Answered step by step
Verified Expert Solution
Question
1 Approved Answer
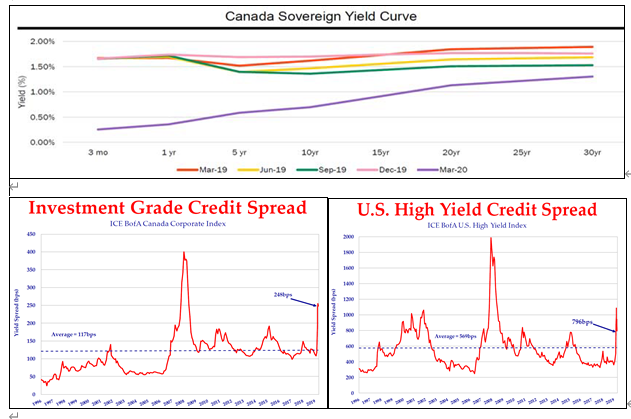
Based on the yield curve and spread charts above (as at 3/31/2020), can anyone explain overall market environment? Ex. performance for various bonds with respect

Based on the yield curve and spread charts above (as at 3/31/2020), can anyone explain overall market environment?
Ex. performance for various bonds with respect to long term or short term, governments or investment grade or high yield, etc.
Yield (%) pads P J 2.00% 1.50% 1.00% 0.50% 0.00% 450 300 250 200 3 mo 150 Investment Grade Credit Spread ICE BofA Canada Corporate Index Average-117bps 1 yr Canada Sovereign Yield Curve chrit Mar-19 5 yr 10yr -Jun-19-Sep-19 2000 1800 1300 600 400 15yr 20yr -Dec-19 -Mar-20 200 25yr U.S. High Yield Credit Spread ICE BofAUS. High Yield Index 30yr Average
Step by Step Solution
★★★★★
3.42 Rating (158 Votes )
There are 3 Steps involved in it
Step: 1
Based on the yield curve and spread charts as of 3312020 the overall market environment can be descr...
Get Instant Access to Expert-Tailored Solutions
See step-by-step solutions with expert insights and AI powered tools for academic success
Step: 2

Step: 3

Ace Your Homework with AI
Get the answers you need in no time with our AI-driven, step-by-step assistance
Get Started


