

Answered step by step
Verified Expert Solution
Question
1 Approved Answer
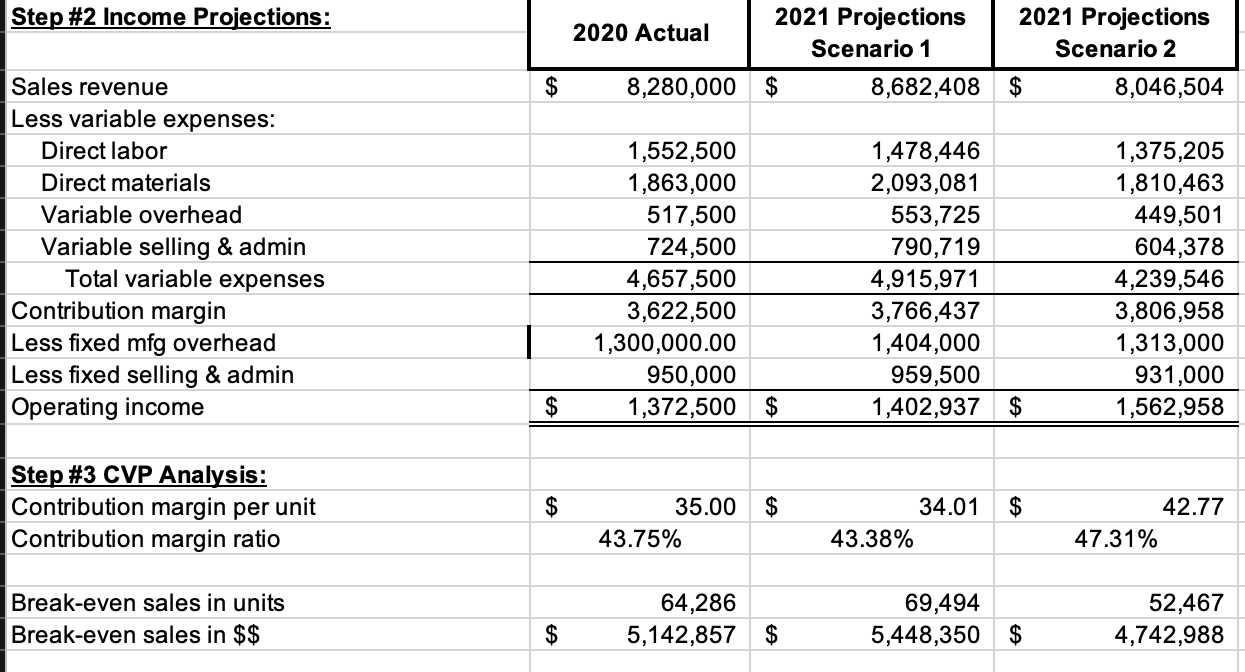
based on these numbers indicate which scenario you would recommend for 2021 with a detailed description as to why you prefer that scenario. Step #2
based on these numbers indicate which scenario you would recommend for 2021 with a detailed description as to why you prefer that scenario.
Step by Step Solution
There are 3 Steps involved in it
Step: 1

Get Instant Access to Expert-Tailored Solutions
See step-by-step solutions with expert insights and AI powered tools for academic success
Step: 2

Step: 3
Ace Your Homework with AI
Get the answers you need in no time with our AI-driven, step-by-step assistance
Get Started
Understanding Business And Finance An Active Learning Approach Promoting Act
Authors: Jill Hussey
1st Edition
9781858050799