

Question
Based on these ratios, which of the following transactions and events would result in a deterioration in Dividends per share in year 2021? a) the
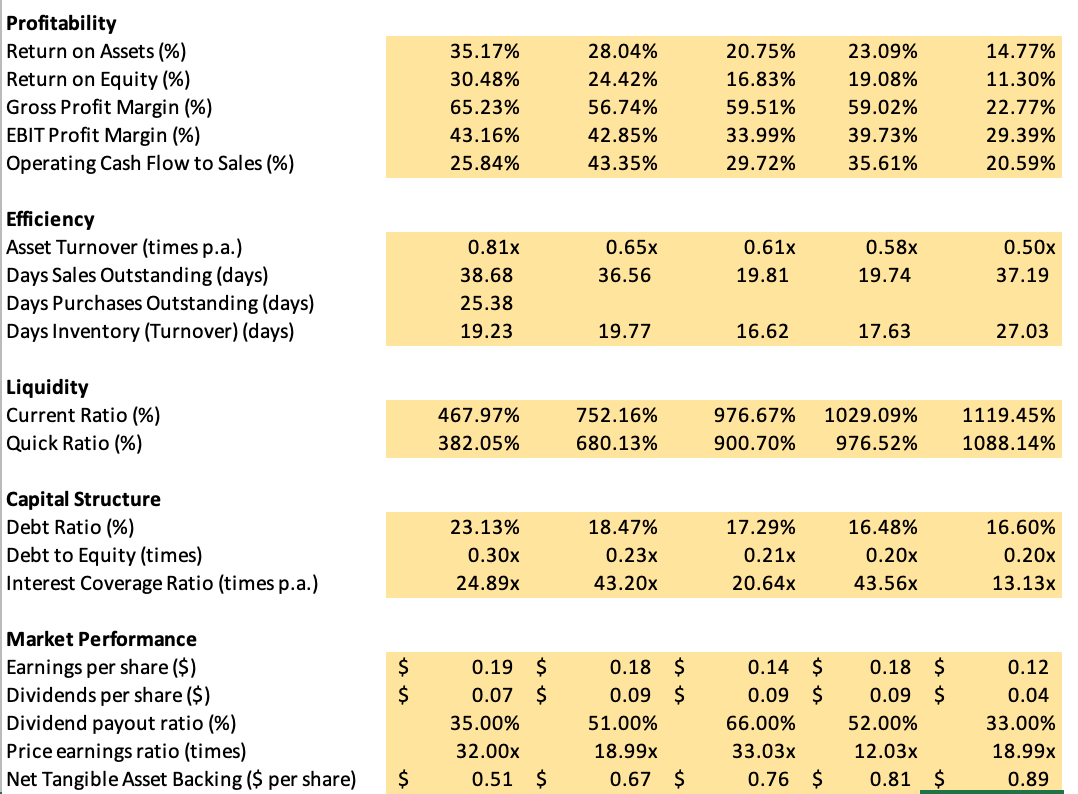
- Based on these ratios, which of the following transactions and events would result in a deterioration in Dividends per share in year 2021?
a) the recognition of income tax expense owing at the end of the period
b) a payment for administrative expenses incurred during the period
c) selling goods on credit at the normal mark-up
d) A and B only
e) A and C only
f) B and C only
g) All of the above
h) None of the above
2. (this questions relates to the final year of the data) The company is currently managing all its payments as timely a fashion as possible, and does not wish to pay any invoices late. A major supplier offers a small discount to reduce the credit terms for its invoices to 20 days. The company is considering whether it should accept this offer given its payments processing capacity.
ProfitabilityReturnonAssets(%)ReturnonEquity(%)GrossProfitMargin(%)EBITProfitMargin(%)OperatingCashFlowtoSales(%)35.17%30.48%65.23%43.16%25.84%28.04%24.42%56.74%42.85%43.35%20.75%16.83%59.51%33.99%29.72%23.09%19.08%59.02%39.73%35.61%14.77%11.30%22.77%20.59% Efficiency Asset Turnover (times p.a.) Days Sales Outstanding (days) Days Purchases Outstanding (days) Days Inventory (Turnover) (days) Liquidity Current Ratio (\%) Quick Ratio (\%) Capital Structure Debt Ratio (\%) Debt to Equity (times) Interest Coverage Ratio (times p.a.) Market Performance Earnings per share ($) Dividends per share ($) Dividend payout ratio (\%) Price earnings ratio (times) Net Tangible Asset Backing (\$ per share) 0.81x38.6825.3819.230.65x36.5619.770.61x19.8116.620.58x19.7417.630.50x37.1927.03 \begin{tabular}{rrrrr} \hline 467.97% & 752.16% & 976.67% & 1029.09% & 1119.45% \\ 382.05% & 680.13% & 900.70% & 976.52% & 1088.14% \end{tabular} 23.13%0.30x24.89x18.47%0.23x43.20x17.29%0.21x20.64x16.48%0.20x43.56x16.60%0.20x13.13x $$$0.190.0735.00%32.00x0.51$$$0.180.0951.00%18.99x0.67$$$0.140.0966.00%33.03x0.76$$$0.180.0952.00%12.03x0.81$$$0.120.0433.00%18.99x0.89 ProfitabilityReturnonAssets(%)ReturnonEquity(%)GrossProfitMargin(%)EBITProfitMargin(%)OperatingCashFlowtoSales(%)35.17%30.48%65.23%43.16%25.84%28.04%24.42%56.74%42.85%43.35%20.75%16.83%59.51%33.99%29.72%23.09%19.08%59.02%39.73%35.61%14.77%11.30%22.77%20.59% Efficiency Asset Turnover (times p.a.) Days Sales Outstanding (days) Days Purchases Outstanding (days) Days Inventory (Turnover) (days) Liquidity Current Ratio (\%) Quick Ratio (\%) Capital Structure Debt Ratio (\%) Debt to Equity (times) Interest Coverage Ratio (times p.a.) Market Performance Earnings per share ($) Dividends per share ($) Dividend payout ratio (\%) Price earnings ratio (times) Net Tangible Asset Backing (\$ per share) 0.81x38.6825.3819.230.65x36.5619.770.61x19.8116.620.58x19.7417.630.50x37.1927.03 \begin{tabular}{rrrrr} \hline 467.97% & 752.16% & 976.67% & 1029.09% & 1119.45% \\ 382.05% & 680.13% & 900.70% & 976.52% & 1088.14% \end{tabular} 23.13%0.30x24.89x18.47%0.23x43.20x17.29%0.21x20.64x16.48%0.20x43.56x16.60%0.20x13.13x $$$0.190.0735.00%32.00x0.51$$$0.180.0951.00%18.99x0.67$$$0.140.0966.00%33.03x0.76$$$0.180.0952.00%12.03x0.81$$$0.120.0433.00%18.99x0.89
Step by Step Solution
There are 3 Steps involved in it
Step: 1

Get Instant Access to Expert-Tailored Solutions
See step-by-step solutions with expert insights and AI powered tools for academic success
Step: 2

Step: 3
Ace Your Homework with AI
Get the answers you need in no time with our AI-driven, step-by-step assistance
Get Started
Portfolio Of Marketing Audits Company Self Assessment Audits
Authors: David Crosby
1st Edition
1902433157, 978-1902433158