

Question
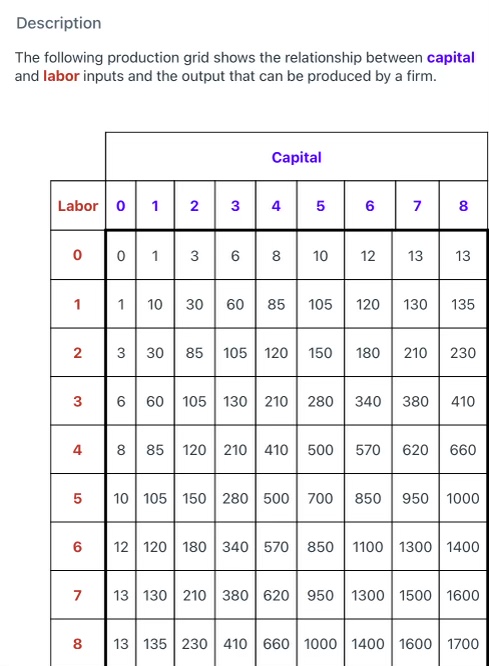
Based on this information use Excel Charts to do the following: (a) Set up an isoquant map with isoquants representing output levels of 10, 105,

Based on this information use Excel Charts to do the following:
(a) Set up an isoquant map with isoquants representing output levels of 10, 105, and 410 units of output.
(b) Set up a diagram showing the firm's short run production function assuming that the firm has only one unit of capital.
(c) Set up a diagram showing the firm's marginal product schedule assuming that the firm has only one unit of capital.
(d) Assume that capital is fixed at one unit in the short run and that the costs associated with the use of fixed inputs are $30 per period, while the wage rate is $10 per unit of labor per period. Use this information to perform the calculations necessary to set up a diagram showing total cost (TC) and total variable cost (TVC) of the firm per period in the short run.
(e) Also, use the information in part c to then set up a another diagram showing the firm's short run marginal cost (MC), average total cost (ATC), and average variable cost (AVC) in the range from 10 to 135 units of output.
Step by Step Solution
There are 3 Steps involved in it
Step: 1

Get Instant Access to Expert-Tailored Solutions
See step-by-step solutions with expert insights and AI powered tools for academic success
Step: 2

Step: 3
Ace Your Homework with AI
Get the answers you need in no time with our AI-driven, step-by-step assistance
Get Started
Macroeconomics
Authors: Stephen d. Williamson
5th Canadian edition
133847144, 9780134604794 , 978-0133847147