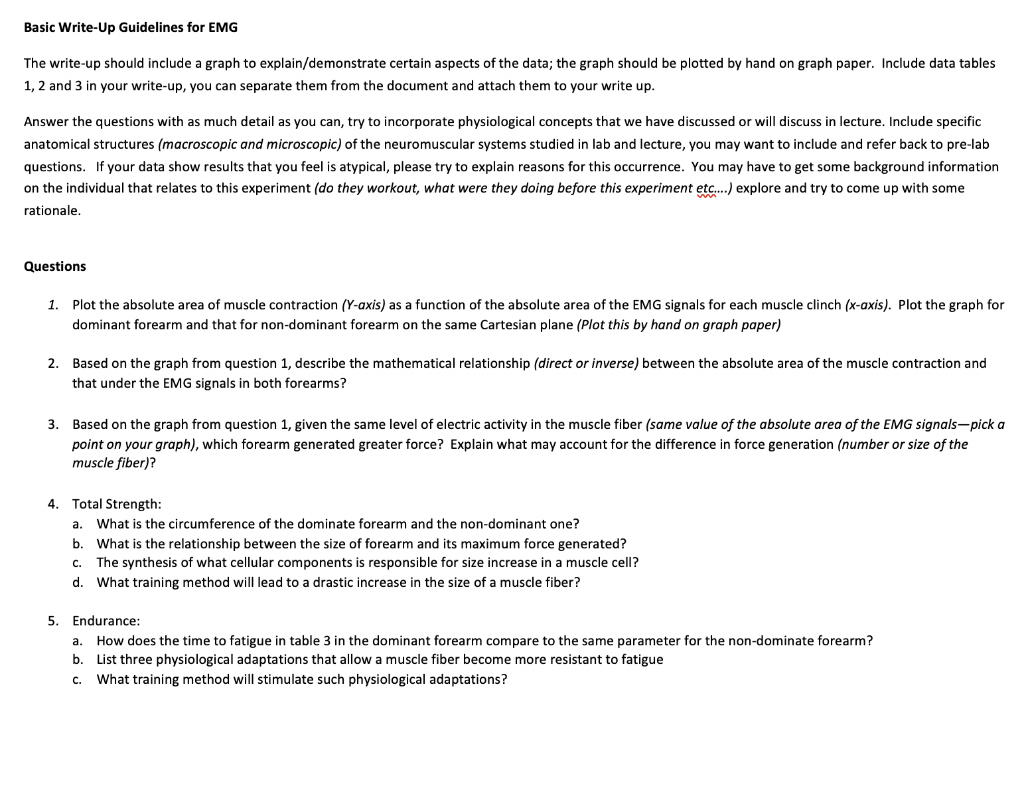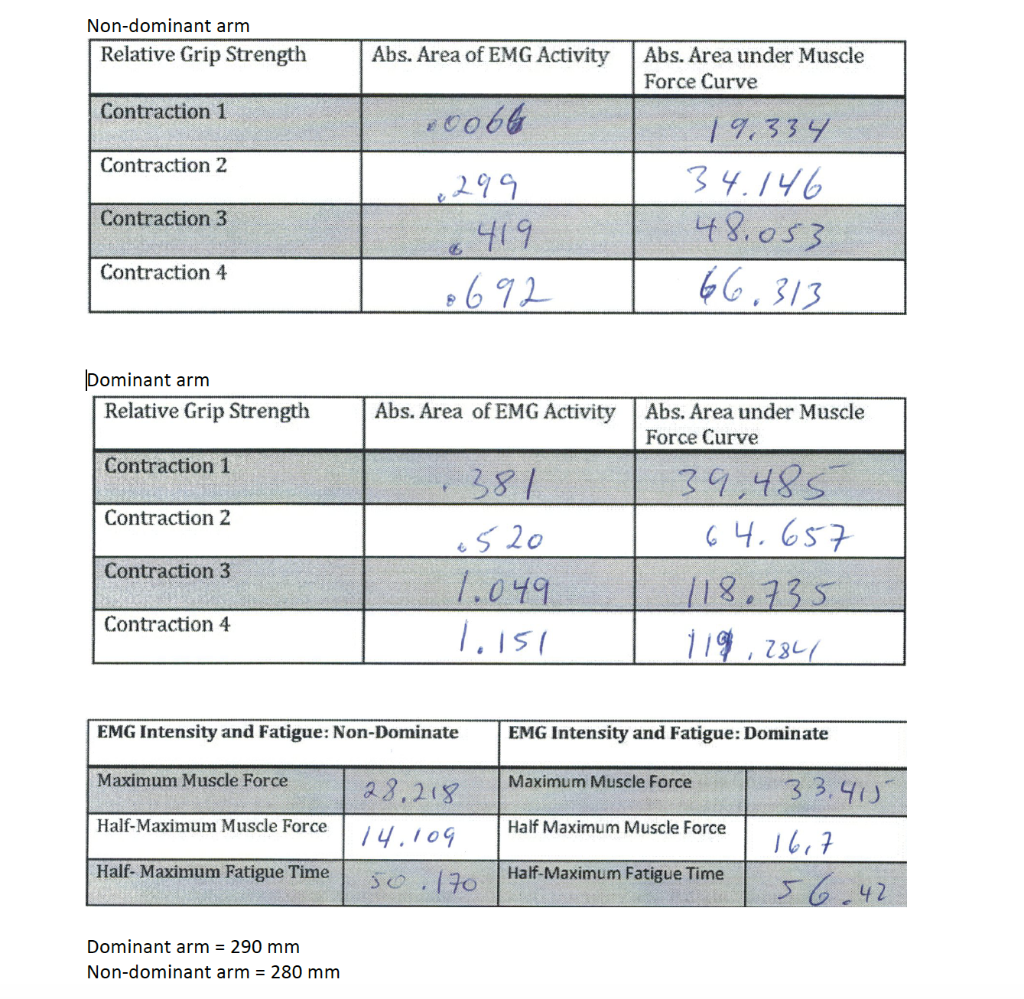

Basic Write-Up Guidelines for EMG The write-up should include a graph to explain/demonstrate certain aspects of the data; the graph should be plotted by hand on graph paper. Include data tables 1, 2 and 3 in your write-up, you can separate them from the document and attach them to your write up. Answer the questions with as much detail as you can, try to incorporate physiological concepts that we have discussed or will discuss in lecture. Include specific anatomical structures (macroscopic and microscopic) of the neuromuscular systems studied in lab and lecture, you may want to include and refer back to pre-lab questions. If your data show results that you feel is atypical, please try to explain reasons for this occurrence. You may have to get some background information on the individual that relates to this experiment (do they workout, what were they doing before this experiment etc...) explore and try to come up with some rationale. Questions 1. Plot the absolute area of muscle contraction (Y-axis) as a function of the absolute area of the EMG signals for each muscle clinch (x-axis). Plot the graph for dominant forearm and that for non-dominant forearm on the same Cartesian plane (Plot this by hand on graph paper) 2. Based on the graph from question 1, describe the mathematical relationship (direct or inverse) between the absolute area of the muscle contraction and that under the EMG signals in both forearms? 3. Based on the graph from question 1, given the same level of electric activity in the muscle fiber (same value of the absolute area of the EMG signals-pick a point on your graph), which forearm generated greater force? Explain what may account for the difference in force generation (number or size of the muscle fiber)? 4. Total Strength: a. What is the circumference of the dominate forearm and the non-dominant one? b. What is the relationship between the size of forearm and its maximum force generated? c. The synthesis of what cellular components is responsible for size increase in a muscle cell? d. What training method will lead to a drastic increase in the size of a muscle fiber? a. 5. Endurance: How does the time to fatigue in table 3 in the dominant forearm compare to the same parameter for the non-dominate forearm? b. List three physiological adaptations that allow a muscle fiber become more resistant to fatigue What training method will stimulate such physiological adaptations? C. Non-dominant arm Relative Grip Strength Abs. Area of EMG Activity Abs. Area under Muscle Force Curve Contraction 1 0066 Contraction 2 19,334 34.146 48.053 +299 419 692 Contraction 3 Contraction 4 66,313 Dominant arm Relative Grip Strength Abs. Area of EMG Activity Abs. Area under Muscle Force Curve Contraction 1 381 Contraction 2 Contraction 3 520 1.049 1.151 39,485 64.657 118.735 119.784 Contraction 4 EMG Intensity and Fatigue: Non-Dominate EMG Intensity and Fatigue: Dominate Maximum Muscle Force Maximum Muscle Force 33.415 Half-Maximum Muscle Force 28.218 14.109 5o. 170 Half Maximum Muscle Force Half- Maximum Fatigue Time Half-Maximum Fatigue Time 1617 56.42 Dominant arm = 290 mm Non-dominant arm = 280 mm Basic Write-Up Guidelines for EMG The write-up should include a graph to explain/demonstrate certain aspects of the data; the graph should be plotted by hand on graph paper. Include data tables 1, 2 and 3 in your write-up, you can separate them from the document and attach them to your write up. Answer the questions with as much detail as you can, try to incorporate physiological concepts that we have discussed or will discuss in lecture. Include specific anatomical structures (macroscopic and microscopic) of the neuromuscular systems studied in lab and lecture, you may want to include and refer back to pre-lab questions. If your data show results that you feel is atypical, please try to explain reasons for this occurrence. You may have to get some background information on the individual that relates to this experiment (do they workout, what were they doing before this experiment etc...) explore and try to come up with some rationale. Questions 1. Plot the absolute area of muscle contraction (Y-axis) as a function of the absolute area of the EMG signals for each muscle clinch (x-axis). Plot the graph for dominant forearm and that for non-dominant forearm on the same Cartesian plane (Plot this by hand on graph paper) 2. Based on the graph from question 1, describe the mathematical relationship (direct or inverse) between the absolute area of the muscle contraction and that under the EMG signals in both forearms? 3. Based on the graph from question 1, given the same level of electric activity in the muscle fiber (same value of the absolute area of the EMG signals-pick a point on your graph), which forearm generated greater force? Explain what may account for the difference in force generation (number or size of the muscle fiber)? 4. Total Strength: a. What is the circumference of the dominate forearm and the non-dominant one? b. What is the relationship between the size of forearm and its maximum force generated? c. The synthesis of what cellular components is responsible for size increase in a muscle cell? d. What training method will lead to a drastic increase in the size of a muscle fiber? a. 5. Endurance: How does the time to fatigue in table 3 in the dominant forearm compare to the same parameter for the non-dominate forearm? b. List three physiological adaptations that allow a muscle fiber become more resistant to fatigue What training method will stimulate such physiological adaptations? C. Non-dominant arm Relative Grip Strength Abs. Area of EMG Activity Abs. Area under Muscle Force Curve Contraction 1 0066 Contraction 2 19,334 34.146 48.053 +299 419 692 Contraction 3 Contraction 4 66,313 Dominant arm Relative Grip Strength Abs. Area of EMG Activity Abs. Area under Muscle Force Curve Contraction 1 381 Contraction 2 Contraction 3 520 1.049 1.151 39,485 64.657 118.735 119.784 Contraction 4 EMG Intensity and Fatigue: Non-Dominate EMG Intensity and Fatigue: Dominate Maximum Muscle Force Maximum Muscle Force 33.415 Half-Maximum Muscle Force 28.218 14.109 5o. 170 Half Maximum Muscle Force Half- Maximum Fatigue Time Half-Maximum Fatigue Time 1617 56.42 Dominant arm = 290 mm Non-dominant arm = 280 mm


