

Question
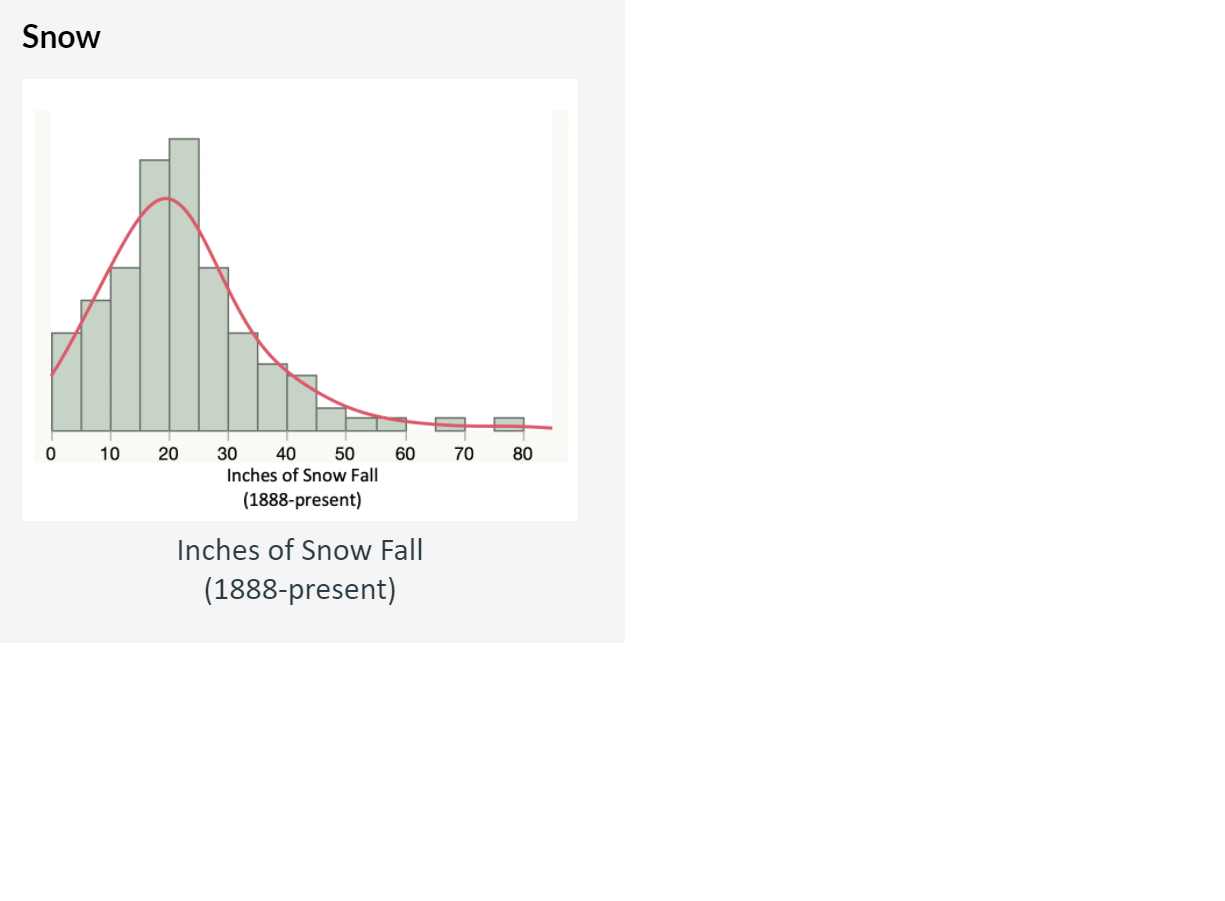
Basically I don't understand histograms.... How can I infer how frequently there were less than 5 inches of snow without knowing the Y axis values?
Basically I don't understand histograms.... How can I infer how frequently there were less than 5 inches of snow without knowing the Y axis values?
Do I have to assume that 50% of the distribution is to the left of the median and then eyeball how big the bar 0-5 is compared to the other ones?
a) How frequently did Philadelphia get less than 5 inches of snow?
B) If you wanted to show that years with small amounts of snow are more frequent in the last 50 years than they were a 100 years ago, you should
-Compare the median snowfall in the last 50 years to the median snowfall from 1888-1938.?
-Compare the mean snowfall in the last 50 years to the mean snowfall from 1888-1938.
-Compare the max snowfall in the last 50 years to the max snowfall from 1888-1938.
Step by Step Solution
There are 3 Steps involved in it
Step: 1

Get Instant Access to Expert-Tailored Solutions
See step-by-step solutions with expert insights and AI powered tools for academic success
Step: 2

Step: 3
Ace Your Homework with AI
Get the answers you need in no time with our AI-driven, step-by-step assistance
Get Started
Calculus Early Transcendentals
Authors: James Stewart
8th edition
1285741552, 9781305482463 , 978-1285741550