

Answered step by step
Verified Expert Solution
Question
1 Approved Answer
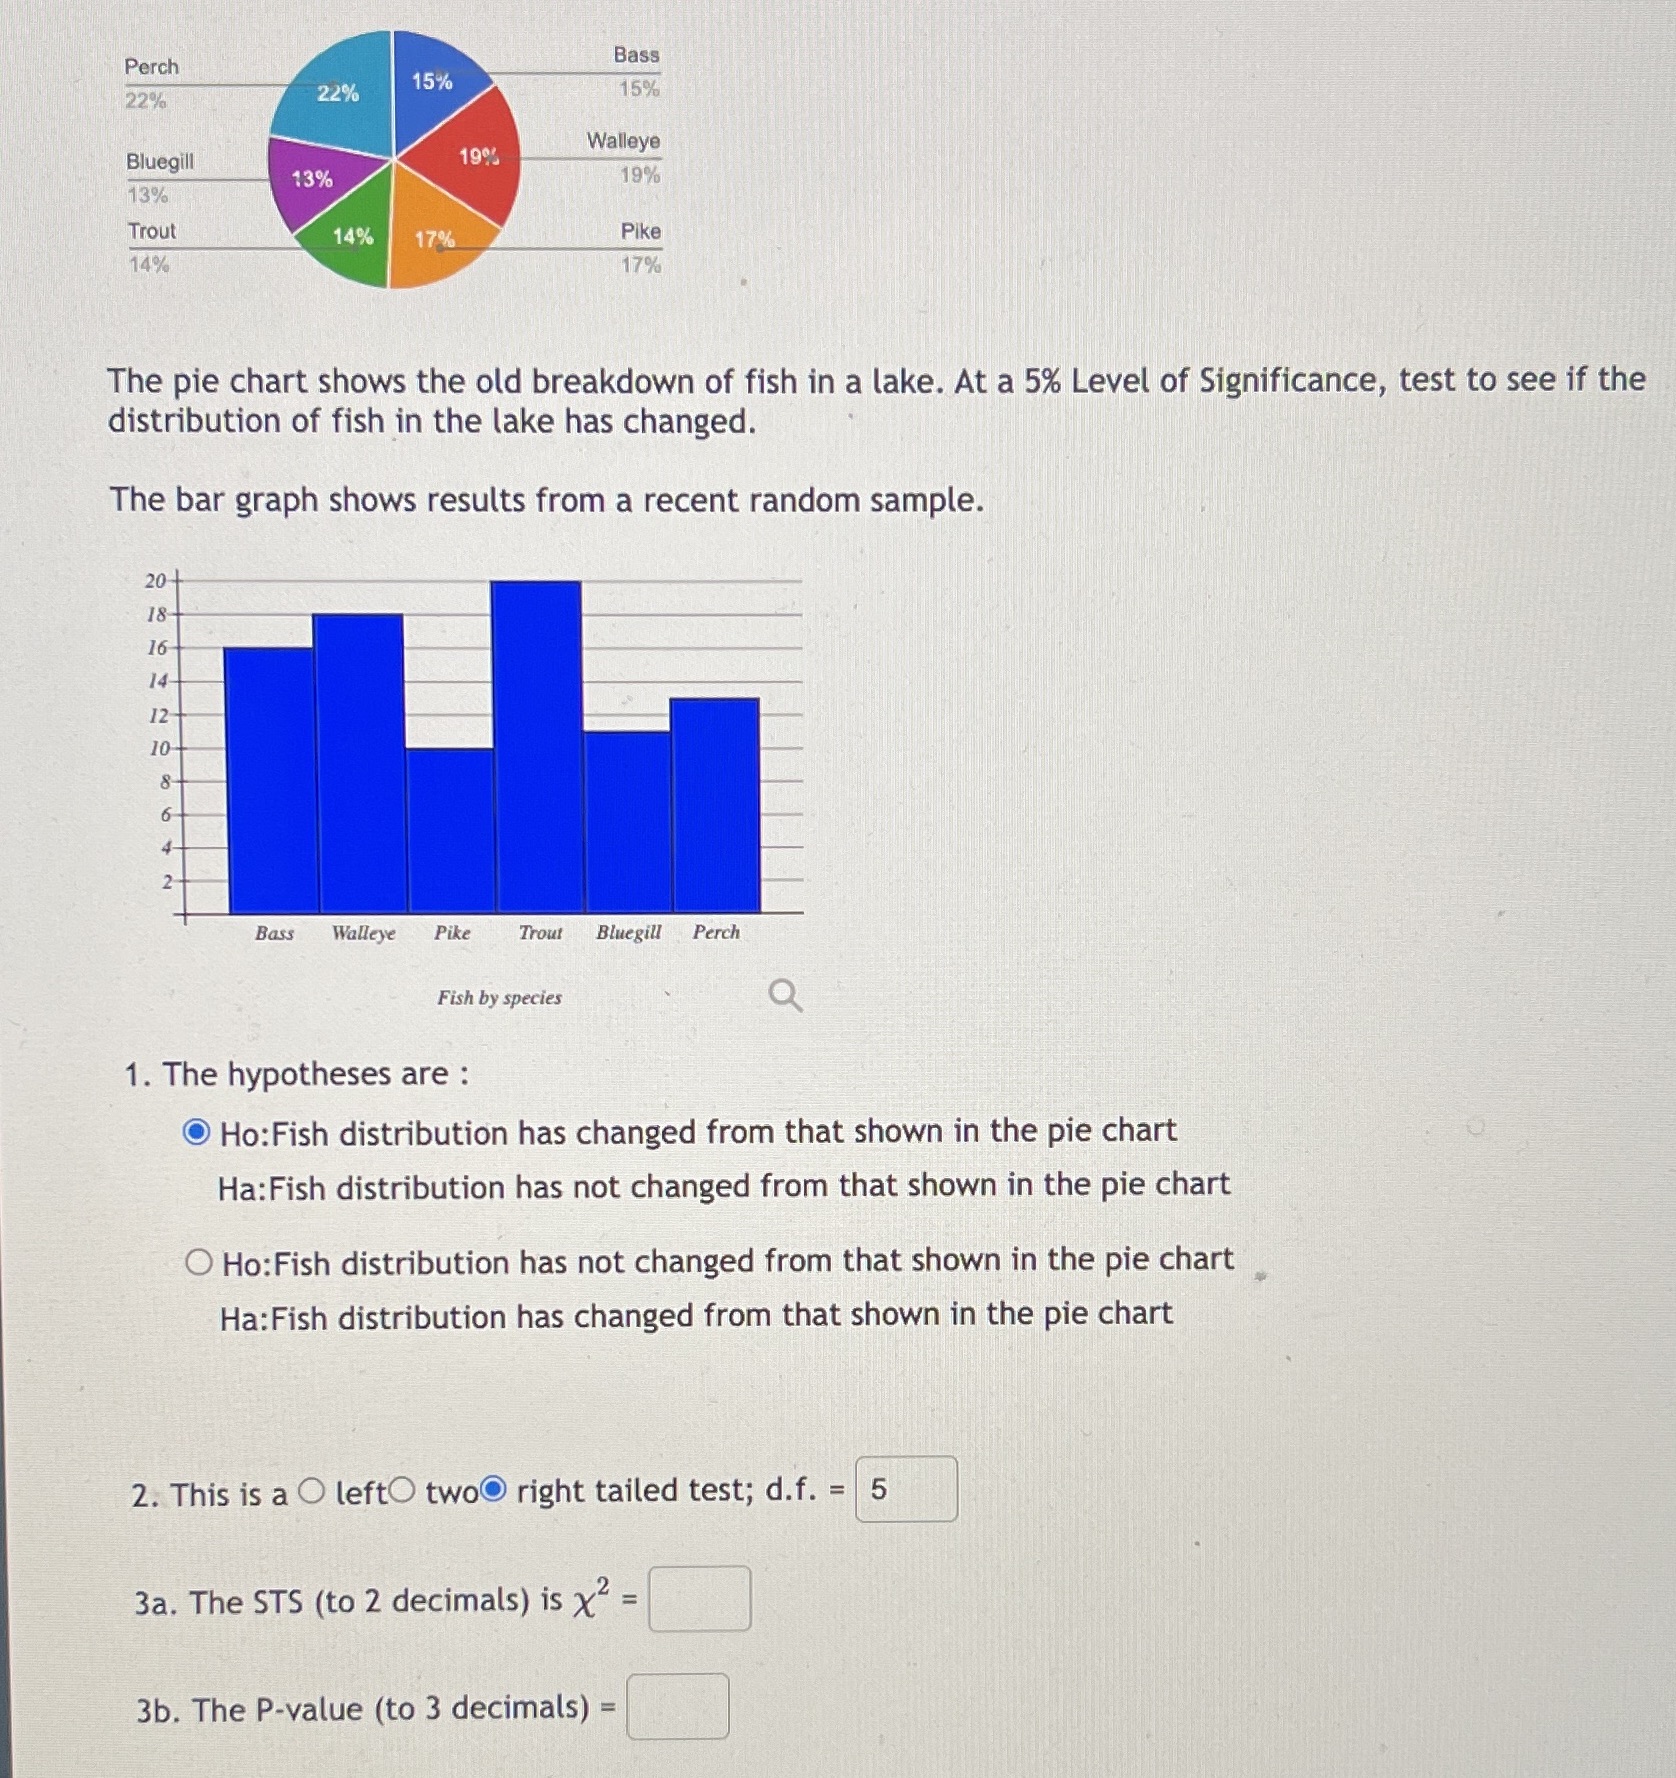
Bass Perch 15% 22% 22% 15% Walleye Bluegill 19% 13% 19% 13% Trout 14% 17% Pike 14% 17% The pie chart shows the old breakdown
Step by Step Solution
There are 3 Steps involved in it
Step: 1

Get Instant Access to Expert-Tailored Solutions
See step-by-step solutions with expert insights and AI powered tools for academic success
Step: 2

Step: 3
Ace Your Homework with AI
Get the answers you need in no time with our AI-driven, step-by-step assistance
Get Started
Chance And Chaos
Authors: David Ruelle
1st Edition
069121395X, 9780691213958