Answered step by step
Verified Expert Solution
Question
1 Approved Answer
BBP, LLC was created by Gordon Shumway and William Tanner in the San Fernando Valley in CA. The pair came up with their idea
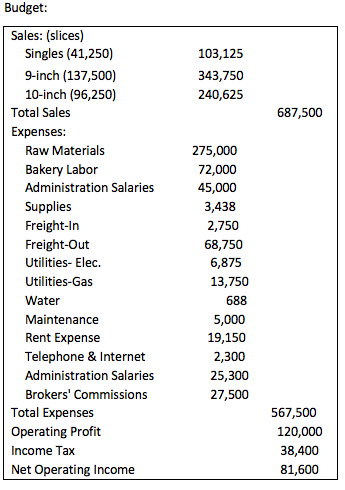
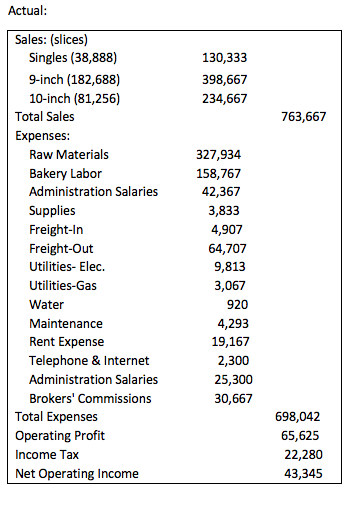
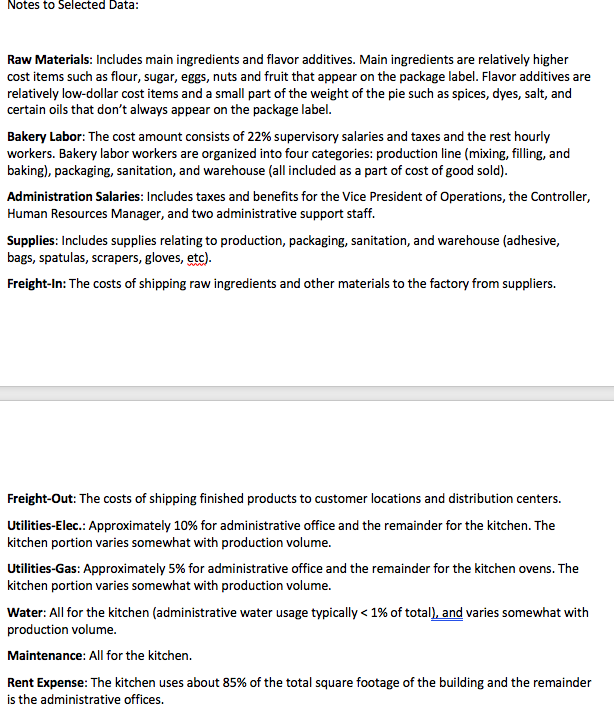
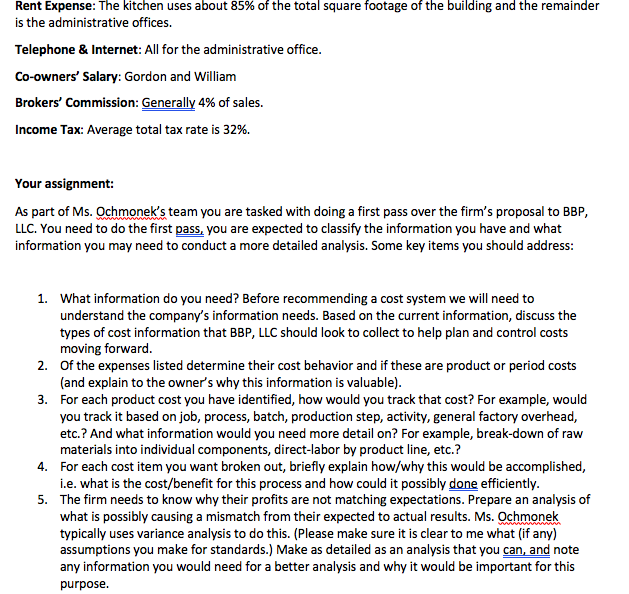
BBP, LLC was created by Gordon Shumway and William Tanner in the San Fernando Valley in CA. The pair came up with their idea in 2008 and by 2009 operations had begun. Beginning out of their home kitchen the two grew a grassroots following in the surrounding area. Once the operation grew outside what they could reasonably produce within a home kitchen the two officially formed their company and applied for, and received, a small business loan. With the loan they purchased a decommissioned machining plant and refitted as a small industrial kitchen. Part of their successful growth they have attributed to their flexibility and willingness to take on custom orders for their best customers. They frequently do limited-run flavors based on customer feedback and will produce custom sizes to meet a variety of customer needs. Gordon spends a lot of time taking in the feedback and deciding which opportunities to accept and which they should pass on. A few years ago demand skyrocketed after bringing Bri Tanner on board to run their social media accounts. Through a dedicated Instagram and Twitter social media presence BBP caught national attention and having been rapidly growing throughout the region with plans for a nationwide roll-out. The company saw $6.1 million in sales last year. While the growth has raised their revenues significantly, overall profits were not growing as the pair expected as their profit margin has shrunk year-over-year. The company has just landed their largest supermarket yet and projected sales are set to jump to $9.3 in the upcoming year, at their current rate of declining margins this would cause them to lose money on the year. They are desperate to keep their costs in line, so they hired an accounting firm run by, Raquel Ochmonek, an accounting professional with her CMA license. Pie Production: BBP, uses natural and organic ingredients and combines traditional recipes with local and unusual flairs like their Avocado Key Lime, Chai Apple Pie, and Chocolate Mole Chess. They produce three major product lines (expected sales mix): Singles, single serving, ready to eat. (15%) 9-inch, pre-sliced and sold to grocery stores for bakery cases or to restaurants and food trucks to sell by the slice. (50%) 10-inch Sold as refrigerated whole pies with custom labels. Available as variety pack, duo-pack (two-flavors), or full pie. (35%) Most pies follow a general four-step process: mixing, filling, baking, and packaging. They have 5 different crust types which are produced in large batches, and their fillings are produced in smaller batches based on their production schedule. Due to the large batch nature, the crust remains cheap to produce with expected crust being $0.10 per slice. Small filling batches gives them the flexibility to create a wide range of flavors to be prepared in a single order. While this allows them to have more flavors the small- batch nature makes them more expensive to produce with ingredients running about $0.90 per pie. Once the items are mixed, the crust are filled with the filling and move onto the baking process. Pies are baked in batches, 15-25 at a time (depending on size). After cooling for one hour, the pies are sliced, packaged, labeled, and placed on pallets to freeze until shipping. It takes about a week to complete a pie product order, but the kitchen is set up to average a pie every five seconds. The team utilizes a high level of hygiene in their workspace and, during production hours, they always keep three trained sanitation workers on duty. Generally, there are 3-4 warehouse workers to handle shipping, and receiving/storing raw materials and finished product. The kitchen runs two shifts per day with a production supervisor assigned to each shift. While the process remains, more or less, the same across the three product lines (Single, 9-inch, and 10- inch) regardless of flavor, the production itself can vary greatly. For instance, a variety pie requires multiple slices of different flavors to be assembled. The packaging and packaging process varies as well, with some being placed in cardboard boxes and others in plastic containers. BBP also labels their direct resale pies with their own label but will also use custom labels of their food service partners. Their current production capacity lets their kitchen do $1 million in sales per month (roughly 50,000 pies or 400,000 slices). However their equipment is a little older and less efficient than some newer items. An upgraded kitchen would cost the firm $500,000, but these upgrades could raise their capacity to $1.5 million per month. Their business has significant seasonal surges with Q4 (October, November, December) being their busiest months due to holiday traffic. Q4 equates to 60% of their yearly sales. To help deal with their seasonality the kitchen runs overtime and weekend shifts as needed to meet the order demands. Gordon frequently complains that the labeling process significantly slows their production down. Reports The management team mostly utilize their "Labor Report" to manage the workforce. The report lists eight salaried workers and (on average) 50 hourly workers, expected work days for the month, hours per day (typically 8), and total hours for the month. Hourly pay ranges between $8.50-12.50 per hour regular hours are based on a 40-hour workweek. Total hourly employee wages are added to the salaried production staff along with any other payroll costs to get "total labor dollars" for each month. This figure is divided by projected sales revenue to find their "projected labor percentage". Management is very vigilant about this figure and always tightens down to ensure it remains around 20%. In the past, it was assumed that labor costs for the company did not change with sales volume, and some months were profitable and some were not. Currently BBP managers try to adjust labor hours up or down to depending on demand for pies and try to keep the projected figure at 20% of sales. Costing Issues Gordon and William are great with understanding pie making, they understand their ingredient costs very intimately, they have made pies and been cooks all their lives. They have never run a factory or been in any other management role before so they struggle to understand what labor and overhead costs are and what are reasonable. They currently allocate the same amount of overhead to every pie. While total labor costs are targeted at 20%, they think that labor and overhead actually vary greatly from product to product. But since they do not track labor hours by product line they have no idea what the real labor costs are between the lines. They currently use a traditional time card system to track employees overall hours, but they are interested in knowing if there is a low-cost, and good reason, to have shift supervisors begin to track hours based on product line. Along with the growth of the kitchen the company also has been growing in administrative staff. They do basic bookkeeping, while the controller is in charge of financial reports, taxes, and decision analysis. The controller is looking to bring in a firm to help deal with getting costs under control. They want a new and updated product costing- system that the company can use for pricing decisions, product-line profitability analysis, financial planning and helping managers understand their business better. The company currently uses what they call "three C's" cost, consumer, competition to help pricing. At the minimum the company feels they need a 17% gross profit margin on cost. Provided is a break-down of their May budget and actual sales data. Budget: Sales: (slices) Singles (41,250) 103,125 9-inch (137,500) 343,750 10-inch (96,250) 240,625 Total Sales 687,500 Expenses: Raw Materials 275,000 Bakery Labor 72,000 Administration Salaries 45,000 Supplies 3,438 Freight-In 2,750 Freight-Out 68,750 Utilities- Elec. 6,875 Utilities-Gas 13,750 Water 688 Maintenance 5,000 Rent Expense 19,150 Telephone & Internet 2,300 Administration Salaries 25,300 Brokers' Commissions 27,500 Total Expenses 567,500 Operating Profit 120,000 Income Tax 38,400 Net Operating Income 81,600 Actual: Sales: (slices) Singles (38,888) 130,333 9-inch (182,688) 398,667 10-inch (81,256) 234,667 Total Sales 763,667 Expenses: Raw Materials 327,934 Bakery Labor 158,767 Administration Salaries 42,367 Supplies 3,833 Freight-In 4,907 Freight-Out 64,707 Utilities- Elec. 9,813 Utilities-Gas 3,067 Water 920 Maintenance 4,293 Rent Expense 19,167 Telephone & Internet 2,300 Administration Salaries 25,300 Brokers' Commissions 30,667 Total Expenses 698,042 Operating Profit 65,625 Income Tax 22,280 Net Operating Income 43,345 Notes to Selected Data: Raw Materials: Includes main ingredients and flavor additives. Main ingredients are relatively higher cost items such as flour, sugar, eggs, nuts and fruit that appear on the package label. Flavor additives are relatively low-dollar cost items and a small part of the weight of the pie such as spices, dyes, salt, and certain oils that don't always appear on the package label. Bakery Labor: The cost amount consists of 22% supervisory salaries and taxes and the rest hourly workers. Bakery labor workers are organized into four categories: production line (mixing, filling, and baking), packaging, sanitation, and warehouse (all included as a part of cost of good sold). Administration Salaries: Includes taxes and benefits for the Vice President of Operations, the Controller, Human Resources Manager, and two administrative support staff. Supplies: Includes supplies relating to production, packaging, sanitation, and warehouse (adhesive, bags, spatulas, scrapers, gloves, etc). Freight-In: The costs of shipping raw ingredients and other materials to the factory from suppliers. Freight-Out: The costs of shipping finished products to customer locations and distribution centers. Utilities-Elec.: Approximately 10% for administrative office and the remainder for the kitchen. The kitchen portion varies somewhat with production volume. Utilities-Gas: Approximately 5% for administrative office and the remainder for the kitchen ovens. The kitchen portion varies somewhat with production volume. Water: All for the kitchen (administrative water usage typically < 1% of total), and varies somewhat with production volume. Maintenance: All for the kitchen. Rent Expense: The kitchen uses about 85% of the total square footage of the building and the remainder is the administrative offices. Rent Expense: The kitchen uses about 85% of the total square footage of the building and the remainder is the administrative offices. Telephone & Internet: All for the administrative office. Co-owners' Salary: Gordon and William Brokers' Commission: Generally 4% of sales. Income Tax: Average total tax rate is 32%. Your assignment: As part of Ms. Ochmonek's team you are tasked with doing a first pass over the firm's proposal to BBP, LLC. You need to do the first pass, you are expected to classify the information you have and what information you may need to conduct a more detailed analysis. Some key items you should address: 1. What information do you need? Before recommending a cost system we will need to understand the company's information needs. Based on the current information, discuss the types of cost information that BBP, LLC should look to collect to help plan and control costs moving forward. 2. Of the expenses listed determine their cost behavior and if these are product or period costs (and explain to the owner's why this information is valuable). 3. For each product cost you have identified, how would you track that cost? For example, would you track it based on job, process, batch, production step, activity, general factory overhead, etc.? And what information would you need more detail on? For example, break-down of raw materials into individual components, direct-labor by product line, etc.? 4. For each cost item you want broken out, briefly explain how/why this would be accomplished, i.e. what is the cost/benefit for this process and how could it possibly done efficiently. 5. The firm needs to know why their profits are not matching expectations. Prepare an analysis of what is possibly causing a mismatch from their expected to actual results. Ms. Ochmonek typically uses variance analysis to do this. (Please make sure it is clear to me what (if any) assumptions you make for standards.) Make as detailed as an analysis that you can, and note any information you would need for a better analysis and why it would be important for this purpose.
Step by Step Solution
There are 3 Steps involved in it
Step: 1

Get Instant Access to Expert-Tailored Solutions
See step-by-step solutions with expert insights and AI powered tools for academic success
Step: 2

Step: 3

Ace Your Homework with AI
Get the answers you need in no time with our AI-driven, step-by-step assistance
Get Started


