Question
BBS has just approached Bulldog requesting a $300,000 loan to strengthen the Cash account and to pay certain, pressing short-term obligations. Bulldog is uncertain whether

BBS has just approached Bulldog requesting a $300,000 loan to strengthen the Cash account and to pay certain, pressing short-term obligations. Bulldog is uncertain whether the loan should be made, and has asked your group to analyze the Companys financial situation and make a recommendation.
You determine the following ratios are typical of companies in BBS industry:
| Current Ratio | 2.5 |
| Acid-Test Ratio | 1.2 |
| Average Collection Period | 18 days |
| Average Sale Period | 50 days |
| Return on Assets | 10% |
| Debt-to-Equity Ratio | 0.75 |
| Times Interest Earned | 6.0 |
| Price-Earnings Ratio | 9 |
What is the Working Capital for the Current and Previous Year?
| A. | Current Year - $960,000 Previous Year - $870,000 | |
| B. | Current Year - $210,000 Previous Year - $120,000 | |
| C. | Current Year - $2,150,000 Previous Year - $1,950,000 | |
| D. | Current Year - $2,900,000 Previous Year - $2,700,000 | |
| E. | Current Year - $0 Previous Year - $0 |
Did the Current Ratio Increase or Decrease from the Previous Year and by how much?
| A. | Increase by 0.28 | |
| B. | Increase by 0.58 | |
| C. | Decrease by 0.58 | |
| D. | Decrease by 0.28 | |
| E. | Increase by 0.03 |
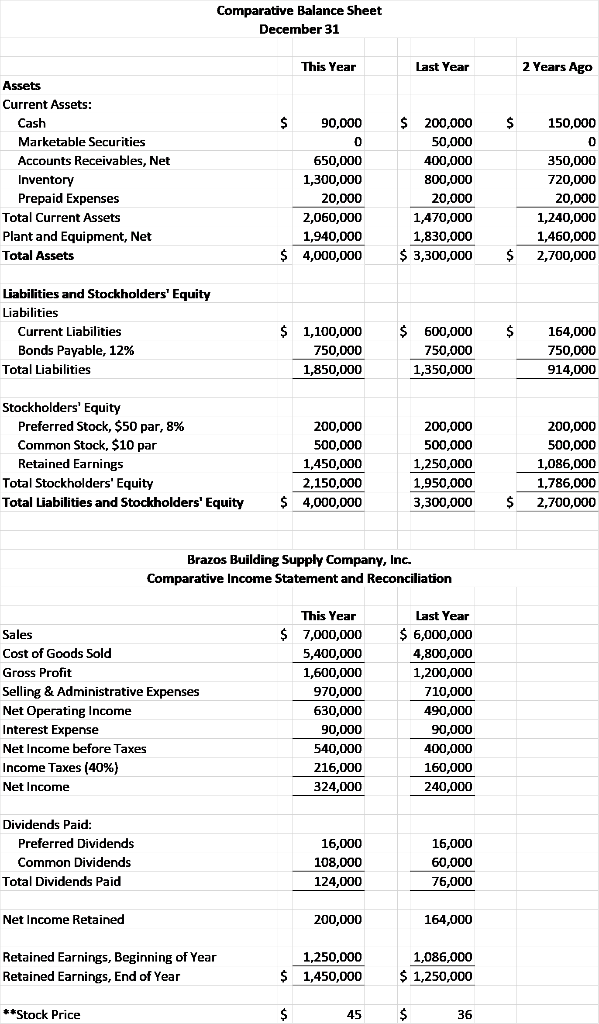
Comparative Balance Sheet December 31 This Year Last Year 2 Years Ago 90,000 $ 150,000 Assets Current Assets: Cash Marketable Securities Accounts Receivables, Net Inventory Prepaid Expenses Total Current Assets Plant and Equipment, Net Total Assets 650,000 1,300,000 20,000 2,060,000 1,940,000 4,000,000 $ 200,000 50,000 400,000 800,000 20,000 1,470,000 1,830,000 $ 3,300,000 350,000 720,000 20,000 1,240,000 1,460,000 2,700,000 $ $ Liabilities and Stockholders' Equity Liabilities Current Liabilities Bonds Payable, 12% Total Liabilities $ $ $ 1,100,000 750,000 1,850,000 600,000 750,000 1,350,000 164,000 750,000 914,000 Stockholders' Equity Preferred Stock, $50 par, 8% Common Stock, $10 par Retained Earnings Total Stockholders' Equity Total Liabilities and Stockholders' Equity 200,000 500,000 1,450,000 2,150,000 4,000,000 200,000 500,000 1,250,000 1,950,000 3,300,000 200,000 500,000 1,086,000 1,786,000 2,700,000 $ $ Brazos Building Supply Company, Inc. Comparative Income Statement and Reconciliation $ Sales Cost of Goods Sold Gross Profit Selling & Administrative Expenses Net Operating Income Interest Expense Net Income before Taxes Income Taxes (40%) Net Income This Year 7,000,000 5,400,000 1,600,000 970,000 630,000 90,000 540,000 216,000 324,000 Last Year $ 6,000,000 4,800,000 1,200,000 710,000 490,000 90,000 400,000 160,000 240,000 Dividends Paid: Preferred Dividends Common Dividends Total Dividends Paid 16,000 108,000 124,000 16,000 60,000 76,000 Net Income Retained 200,000 164,000 Retained Earnings, Beginning of Year Retained Earnings, End of Year $ 1,250,000 1,450,000 1,086,000 $ 1,250,000 **Stock Price $ 45 $ 36
Step by Step Solution
There are 3 Steps involved in it
Step: 1

Get Instant Access to Expert-Tailored Solutions
See step-by-step solutions with expert insights and AI powered tools for academic success
Step: 2

Step: 3

Ace Your Homework with AI
Get the answers you need in no time with our AI-driven, step-by-step assistance
Get Started


