Answered step by step
Verified Expert Solution
Question
1 Approved Answer
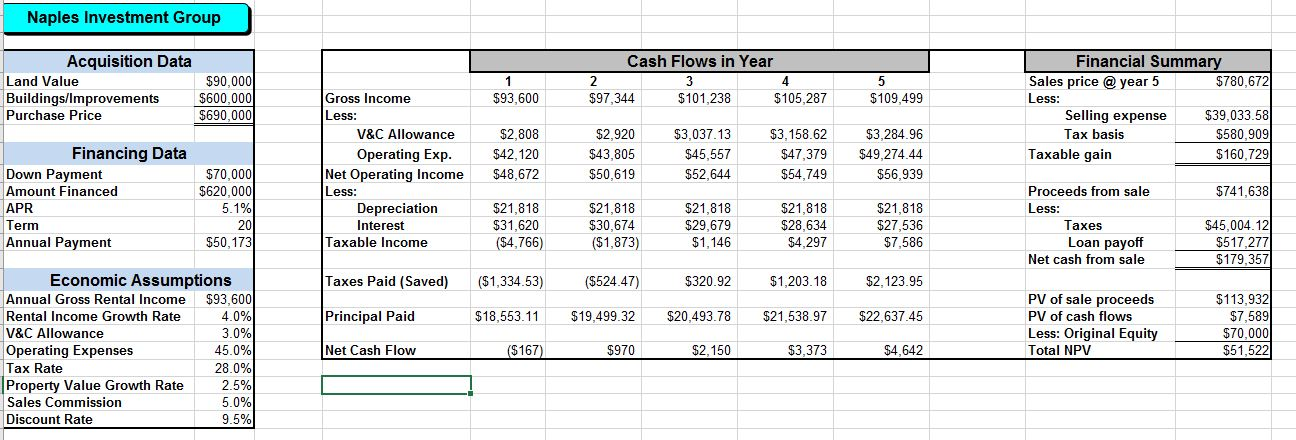
Before you revise the data to adjust for the uncertain variables, conduct a what-if analysis: 1. The group investigated the possibility of financing with a

Before you revise the data to adjust for the uncertain variables, conduct a what-if analysis:
1. The group investigated the possibility of financing with a preferred lender for terms of 15, 20 and 30 years with APRs ranging from 4.5% to 7.5%. Construct a two-way table and provide a brief analysis. The benchmark for a favorable decision is an NPV of $40,000.
2. Using current data, what should be the discount rate for an NPV of $40,000?
Naples Investment Group Acquisition Data Land Value Buildings/Improvements Purchase Price $90,000 $600,000 $690,000 Cash Flows in Year 3 4 $97,344 $101,238 $105,287 5 $109,499 $93,600 Gross Income Less: V&C Allowance Operating Exp. Net Operating Income Financial Summary Sales price @ year 5 $780,672 Less: Selling expense $39,033.58 Tax basis $580,909 Taxable gain $160,729 $2,808 $42,120 $48,672 $2,920 $43,805 $50,619 $3,037.13 $45,557 $52.644 $3,158.62 $47,379 $54,749 $3,284.96 $49,274.44 $56,939 Financing Data Down Payment Amount Financed APR Term Annual Payment Less: $741,638 $70,000 $620,000 5.1% 20 $50,173 Proceeds from sale Less: Depreciation Interest Taxable Income $21,818 $31,620 ($4,766) $21,818 $30,674 ($1,873) $21,818 $29,679 $1.146 $21,818 $28,634 $4.297 $21,818 $27,536 $7.586 Taxes Loan payoff Net cash from sale $45.004.12 $517,277 $179,357 Taxes Paid (Saved) ($1,334.53) ($524.47) $320.92 $1,203.18 $2,123.95 Principal Paid $18,553.11 $19,499.32 $20,493.78 $21,538.97 $22,637.45 Economic Assumptions Annual Gross Rental Income $93.600 Rental Income Growth Rate 4.0% V&C Allowance 3.0% Operating Expenses 45.0% Tax Rate 28.0% Property Value Growth Rate 2.5% Sales Commission 5.0% Discount Rate 9.5% PV of sale proceeds PV of cash flows Less: Original Equity Total NPV $113,932 $7,589 $70,000 $51,522 Net Cash Flow ($167) $970 $2.150 $3,373 $4,642 Naples Investment Group Acquisition Data Land Value Buildings/Improvements Purchase Price $90,000 $600,000 $690,000 Cash Flows in Year 3 4 $97,344 $101,238 $105,287 5 $109,499 $93,600 Gross Income Less: V&C Allowance Operating Exp. Net Operating Income Financial Summary Sales price @ year 5 $780,672 Less: Selling expense $39,033.58 Tax basis $580,909 Taxable gain $160,729 $2,808 $42,120 $48,672 $2,920 $43,805 $50,619 $3,037.13 $45,557 $52.644 $3,158.62 $47,379 $54,749 $3,284.96 $49,274.44 $56,939 Financing Data Down Payment Amount Financed APR Term Annual Payment Less: $741,638 $70,000 $620,000 5.1% 20 $50,173 Proceeds from sale Less: Depreciation Interest Taxable Income $21,818 $31,620 ($4,766) $21,818 $30,674 ($1,873) $21,818 $29,679 $1.146 $21,818 $28,634 $4.297 $21,818 $27,536 $7.586 Taxes Loan payoff Net cash from sale $45.004.12 $517,277 $179,357 Taxes Paid (Saved) ($1,334.53) ($524.47) $320.92 $1,203.18 $2,123.95 Principal Paid $18,553.11 $19,499.32 $20,493.78 $21,538.97 $22,637.45 Economic Assumptions Annual Gross Rental Income $93.600 Rental Income Growth Rate 4.0% V&C Allowance 3.0% Operating Expenses 45.0% Tax Rate 28.0% Property Value Growth Rate 2.5% Sales Commission 5.0% Discount Rate 9.5% PV of sale proceeds PV of cash flows Less: Original Equity Total NPV $113,932 $7,589 $70,000 $51,522 Net Cash Flow ($167) $970 $2.150 $3,373 $4,642
Step by Step Solution
There are 3 Steps involved in it
Step: 1

Get Instant Access to Expert-Tailored Solutions
See step-by-step solutions with expert insights and AI powered tools for academic success
Step: 2

Step: 3

Ace Your Homework with AI
Get the answers you need in no time with our AI-driven, step-by-step assistance
Get Started


