Question
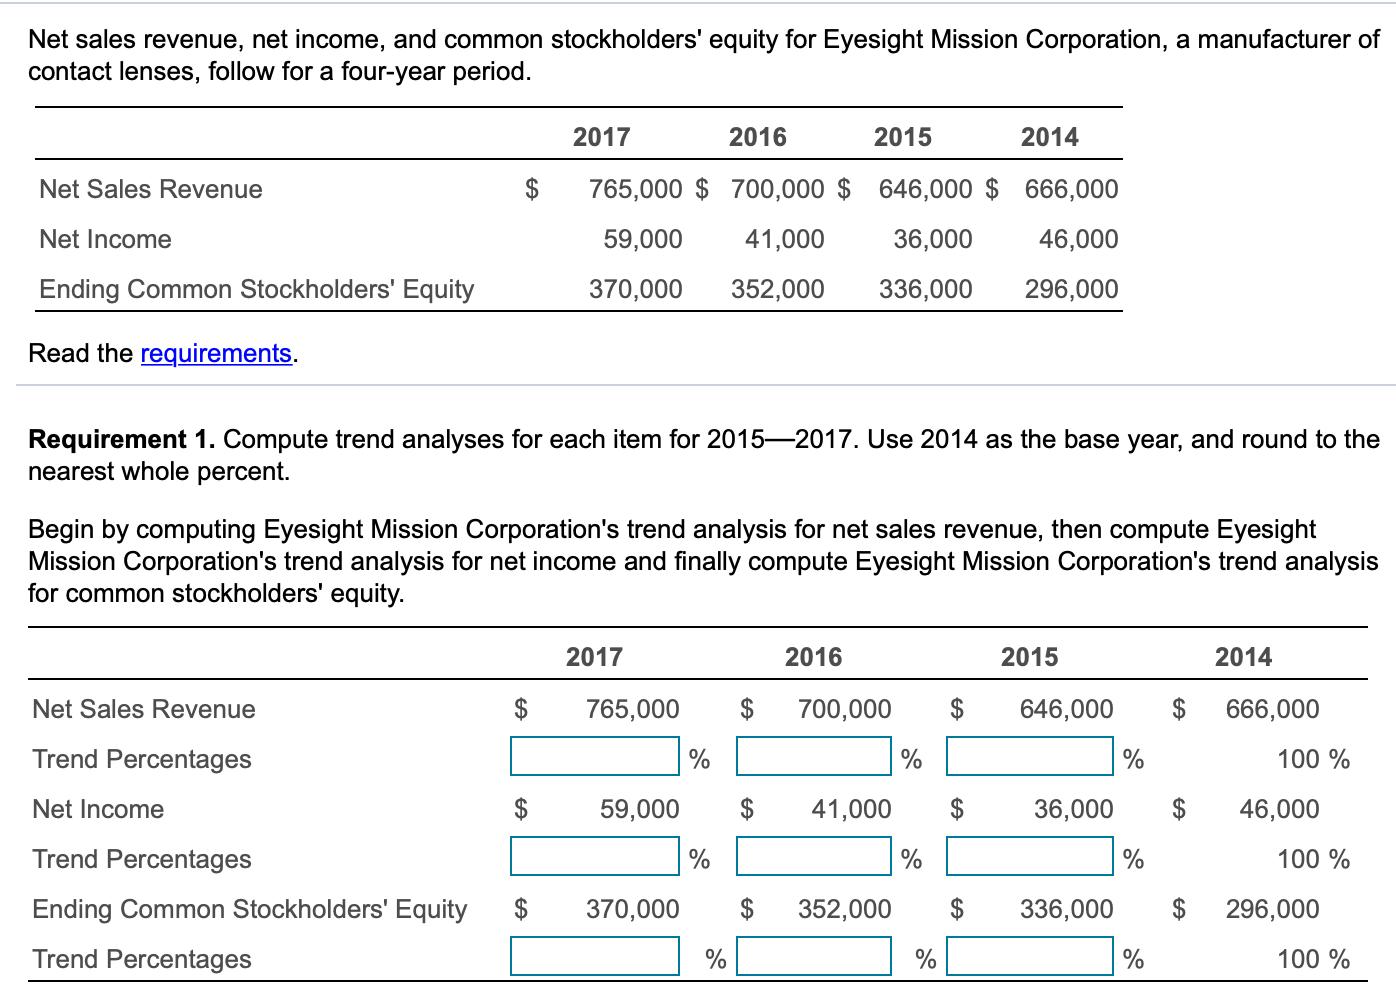
Net sales revenue, net income, and common stockholders' equity for Eyesight Mission Corporation, a manufacturer of contact lenses, follow for a four-year period. Requirement 1.
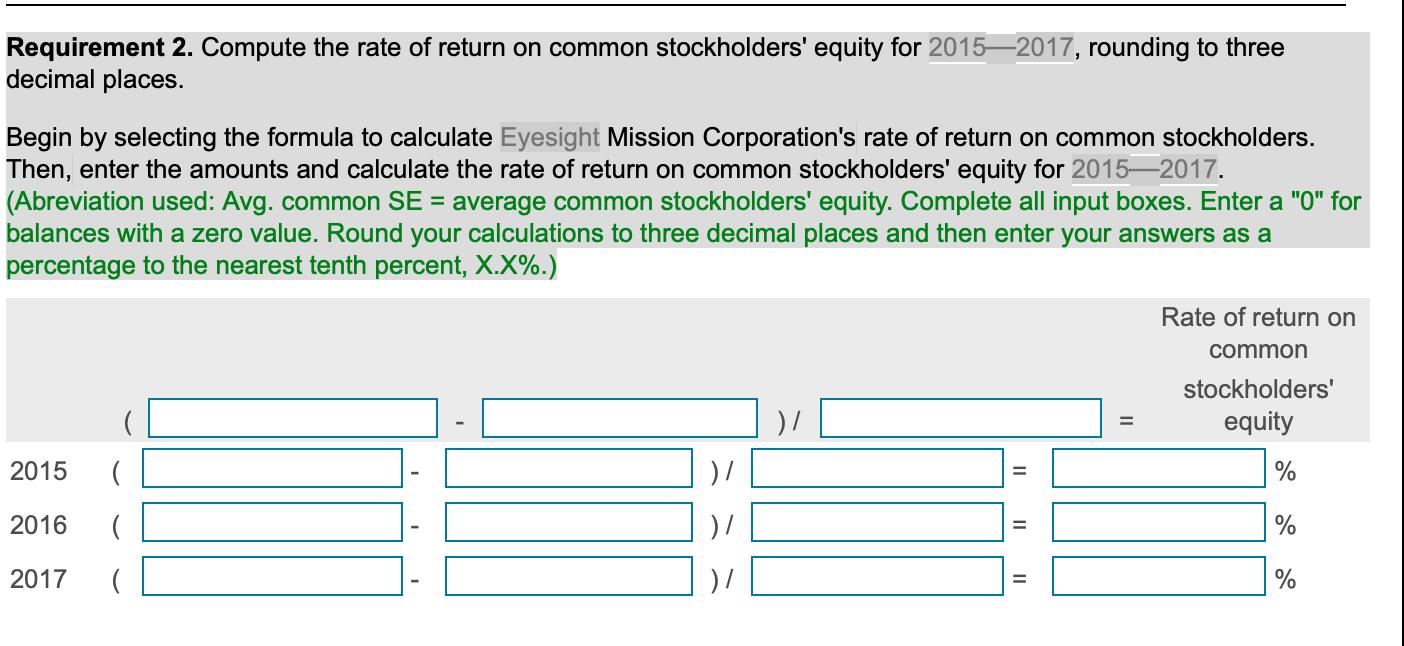
Net sales revenue, net income, and common stockholders' equity for Eyesight Mission Corporation, a manufacturer of contact lenses, follow for a four-year period. Requirement 1. Compute trend analyses for each item for 2015—2017. Use 2014 as the base year, and round to the nearest whole percent. Begin by computing Eyesight Mission Corporation's trend analysis for net sales revenue, then compute Eyesight Mission Corporation's trend analysis for net income and finally compute Eyesight Mission Corporation's trend analysis for common stockholders' equity. Requirement 2. Compute the rate of return on common stockholders' equity for 2015—2017, rounding to three decimal places. Begin by selecting the formula to calculate Eyesight Mission Corporation's rate of return on common stockholders.Then, enter the amounts and calculate the rate of return on common stockholders' equity for 2015—2017. |
Net sales revenue, net income, and common stockholders' equity for Eyesight Mission Corporation, a manufacturer of contact lenses, follow for a four-year period. 2017 2016 2015 2014 Net Sales Revenue 765,000 $ 700,000 $ 646,000 $ 666,000 Net Income 59,000 41,000 36,000 46,000 Ending Common Stockholders' Equity 370,000 352,000 336,000 296,000 Read the requirements. Requirement 1. Compute trend analyses for each item for 20152017. Use 2014 as the base year, and round to the nearest whole percent. Begin by computing Eyesight Mission Corporation's trend analysis for net sales revenue, then compute Eyesight Mission Corporation's trend analysis for net income and finally compute Eyesight Mission Corporation's trend analysis for common stockholders' equity. 2017 2016 2015 2014 Net Sales Revenue $ 765,000 2$ 700,000 2$ 646,000 666,000 Trend Percentages % 100 % Net Income $ 59,000 $ 41,000 36,000 $ 46,000 Trend Percentages 100 % Ending Common Stockholders' Equity $ 370,000 2$ 352,000 $ 336,000 296,000 Trend Percentages % 100 %
Step by Step Solution
3.49 Rating (149 Votes )
There are 3 Steps involved in it
Step: 1
Solution 1 Trend analyses 2017 2016 Netsales Revenue 765000 2015 1 646000 8...
Get Instant Access to Expert-Tailored Solutions
See step-by-step solutions with expert insights and AI powered tools for academic success
Step: 2

Step: 3

Document Format ( 2 attachments)
635d6d39f188c_175506.pdf
180 KBs PDF File
635d6d39f188c_175506.docx
120 KBs Word File
Ace Your Homework with AI
Get the answers you need in no time with our AI-driven, step-by-step assistance
Get Started


 (Abbreviations used: Avg. common SE = average common stockholders' equity. Complete all input boxes. Enter a "0" for balances with a zero value. Round your calculations to three decimal places and then enter your answers as a percentage to the nearest tenth percent, X.X%.)