

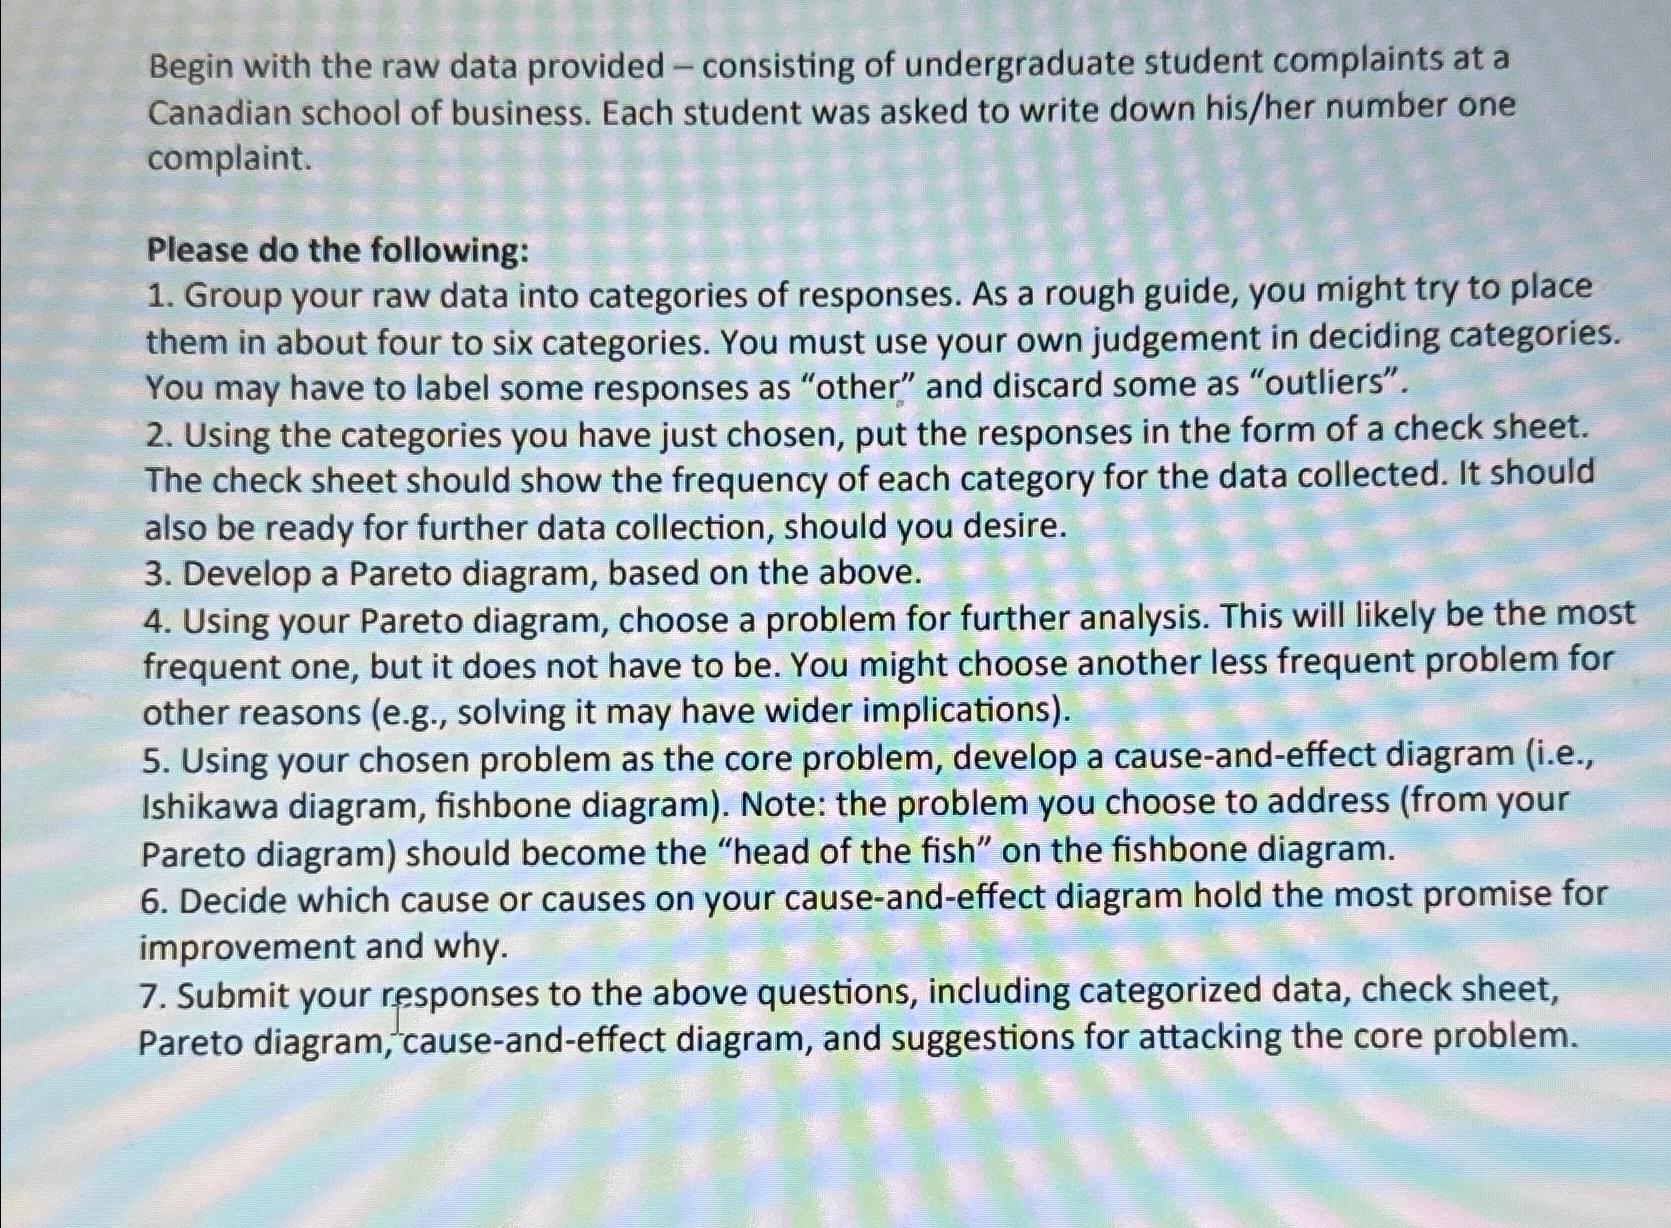
Begin with the raw data provided - consisting of undergraduate student complaints at a Canadian school...
Fantastic news! We've Found the answer you've been seeking!
Question:
Expert Answer:

Related Book For 

Posted Date:
