Answered step by step
Verified Expert Solution
Question
1 Approved Answer
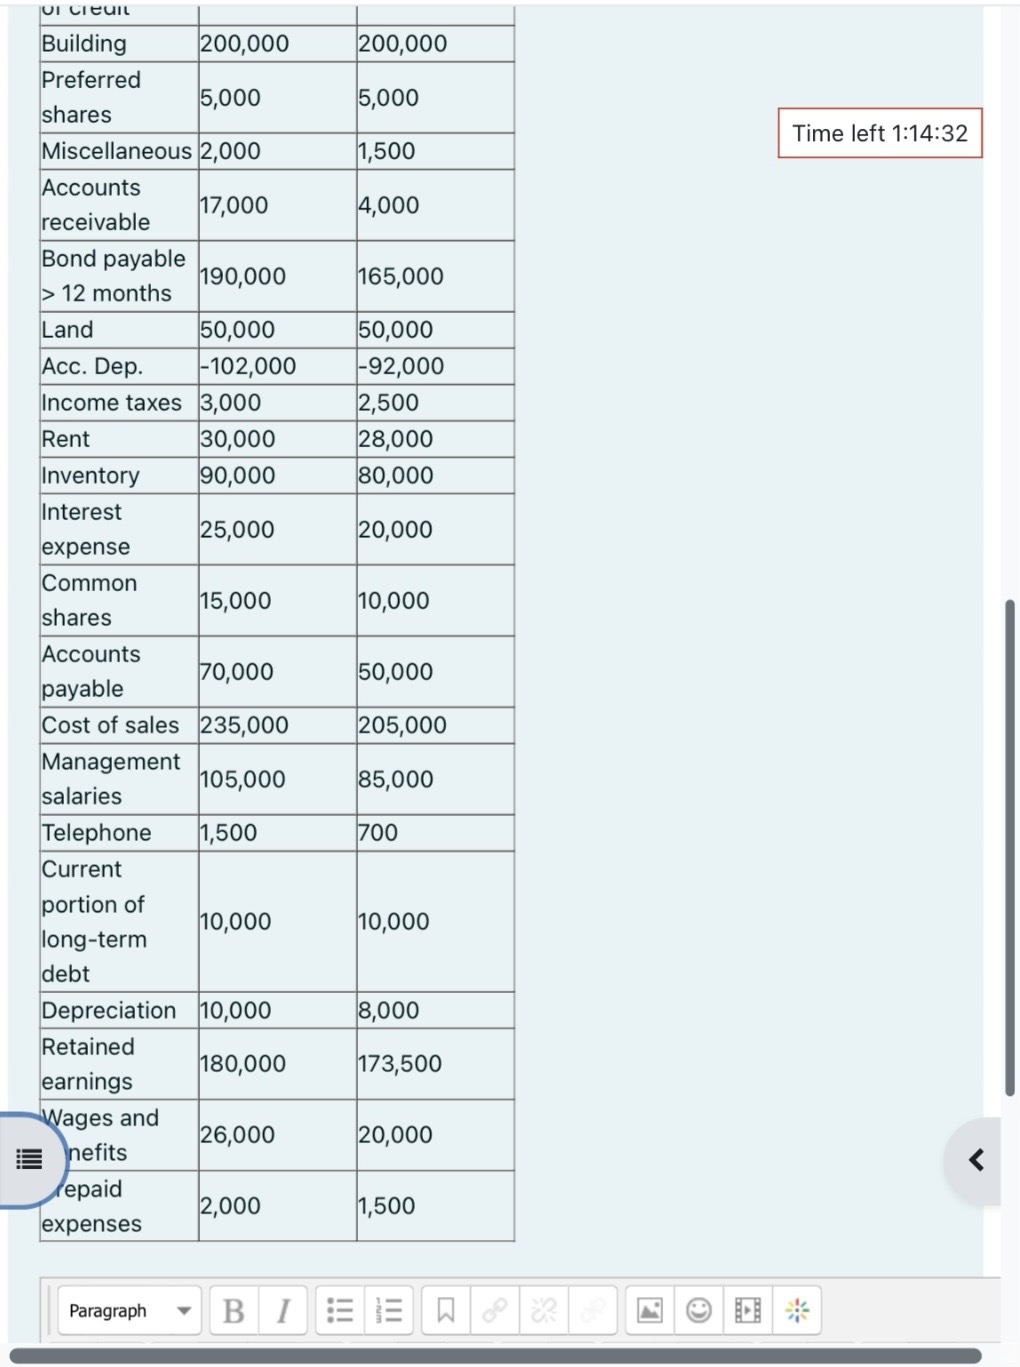
begin{tabular}{|c|c|c|} hline LIII & & hline Building & 200,000 & 200,000 hline Preferredshares & 5,000 & 5,000 hline Miscellaneous & 2,000 &

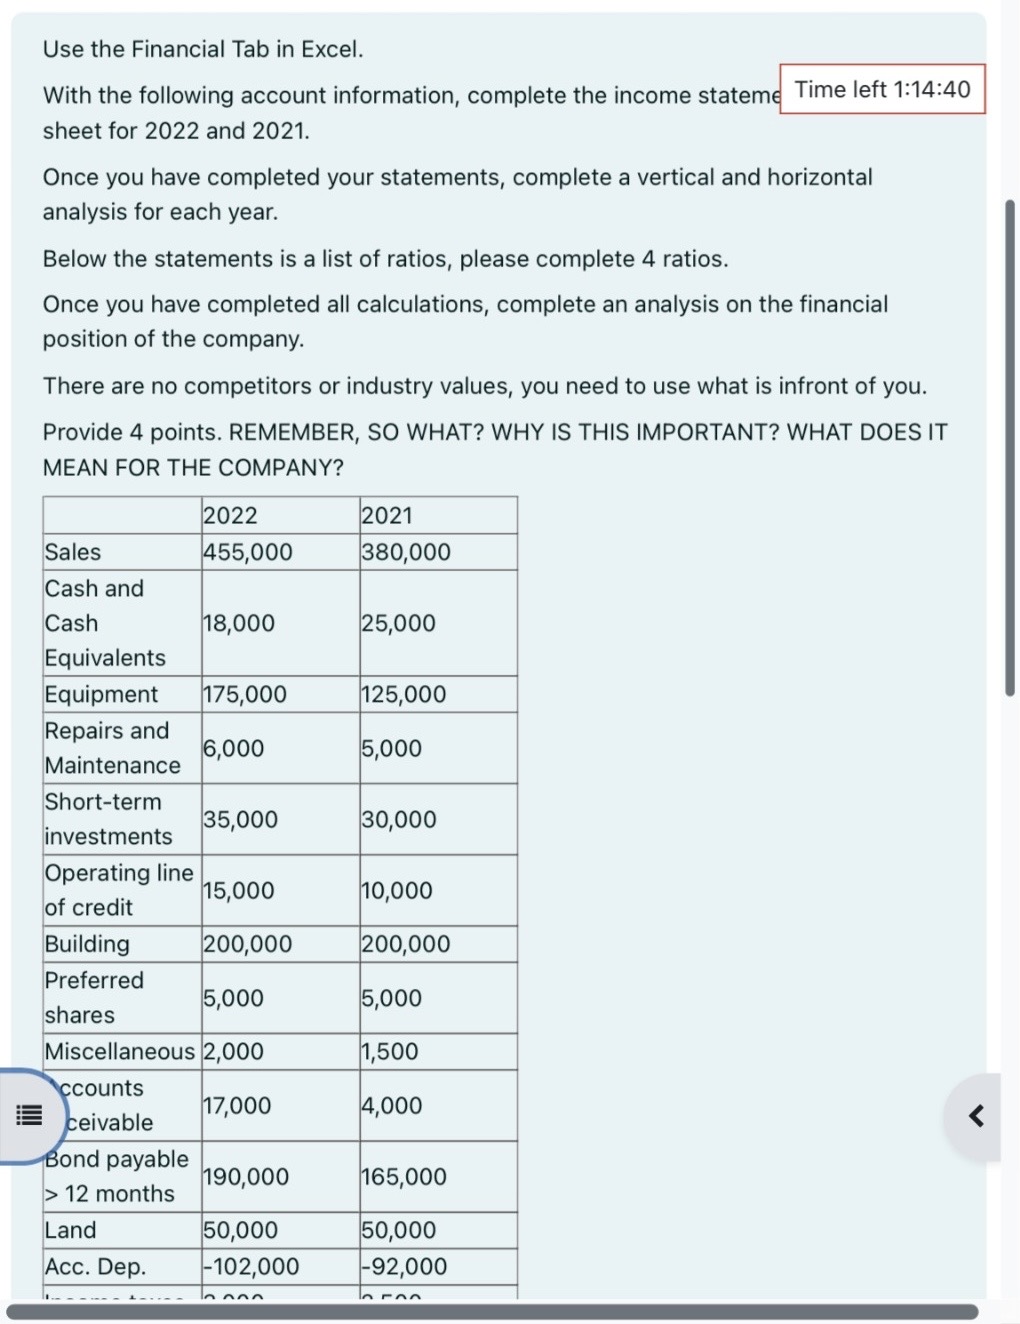
 \begin{tabular}{|c|c|c|} \hline LIII & & \\ \hline Building & 200,000 & 200,000 \\ \hline Preferredshares & 5,000 & 5,000 \\ \hline Miscellaneous & 2,000 & 1,500 \\ \hline Accountsreceivable & 17,000 & 4,000 \\ \hline Bondpayable>12months & 190,000 & 165,000 \\ \hline Land & 50,000 & 50,000 \\ \hline Acc. Dep. & 102,000 & 92,000 \\ \hline Income taxes & 3,000 & 2,500 \\ \hline Rent & 30,000 & 28,000 \\ \hline Inventory & 90,000 & 80,000 \\ \hline Interestexpense & 25,000 & 20,000 \\ \hline Commonshares & 15,000 & 10,000 \\ \hline Accountspayable & 70,000 & 50,000 \\ \hline Cost of sales & 235,000 & 205,000 \\ \hline Managementsalaries & 105,000 & 85,000 \\ \hline Telephone & 1,500 & 700 \\ \hline Currentportionoflong-termdebt & 10,000 & 10,000 \\ \hline Depreciation & 10,000 & 8,000 \\ \hline Retainedearnings & 180,000 & 173,500 \\ \hline Wagesandnefits & 26,000 & 20,000 \\ \hline epaidexpenses & 2,000 & 1,500 \\ \hline \end{tabular} Use the Financial Tab in Excel. With the following account information, complete the income statem sheet for 2022 and 2021. Once you have completed your statements, complete a vertical and horizontal analysis for each year. Below the statements is a list of ratios, please complete 4 ratios. Once you have completed all calculations, complete an analysis on the financial position of the company. There are no competitors or industry values, you need to use what is infront of you. Provide 4 points. REMEMBER, SO WHAT? WHY IS THIS IMPORTANT? WHAT DOES IT MEAN FOR THE COMPANY? \begin{tabular}{|c|c|c|} \hline LIII & & \\ \hline Building & 200,000 & 200,000 \\ \hline Preferredshares & 5,000 & 5,000 \\ \hline Miscellaneous & 2,000 & 1,500 \\ \hline Accountsreceivable & 17,000 & 4,000 \\ \hline Bondpayable>12months & 190,000 & 165,000 \\ \hline Land & 50,000 & 50,000 \\ \hline Acc. Dep. & 102,000 & 92,000 \\ \hline Income taxes & 3,000 & 2,500 \\ \hline Rent & 30,000 & 28,000 \\ \hline Inventory & 90,000 & 80,000 \\ \hline Interestexpense & 25,000 & 20,000 \\ \hline Commonshares & 15,000 & 10,000 \\ \hline Accountspayable & 70,000 & 50,000 \\ \hline Cost of sales & 235,000 & 205,000 \\ \hline Managementsalaries & 105,000 & 85,000 \\ \hline Telephone & 1,500 & 700 \\ \hline Currentportionoflong-termdebt & 10,000 & 10,000 \\ \hline Depreciation & 10,000 & 8,000 \\ \hline Retainedearnings & 180,000 & 173,500 \\ \hline Wagesandnefits & 26,000 & 20,000 \\ \hline epaidexpenses & 2,000 & 1,500 \\ \hline \end{tabular} Use the Financial Tab in Excel. With the following account information, complete the income statem sheet for 2022 and 2021. Once you have completed your statements, complete a vertical and horizontal analysis for each year. Below the statements is a list of ratios, please complete 4 ratios. Once you have completed all calculations, complete an analysis on the financial position of the company. There are no competitors or industry values, you need to use what is infront of you. Provide 4 points. REMEMBER, SO WHAT? WHY IS THIS IMPORTANT? WHAT DOES IT MEAN FOR THE COMPANY
 Step by Step Solution
There are 3 Steps involved in it
Step: 1

Get Instant Access to Expert-Tailored Solutions
See step-by-step solutions with expert insights and AI powered tools for academic success
Step: 2

Step: 3

Ace Your Homework with AI
Get the answers you need in no time with our AI-driven, step-by-step assistance
Get Started


