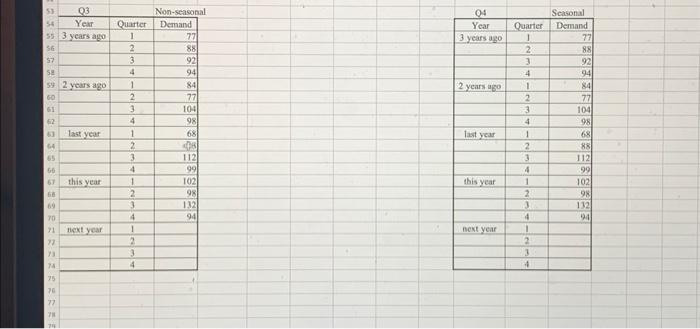
\begin{tabular}{|c|c|r|r|} \hline 53 & \multicolumn{2}{|c|}{ Q3 } & \multicolumn{2}{|c|}{ Non-seasonal } \\ \cline { 2 - 4 } & Year & Quarter & Demand \\ \hline 55 & 3 years ago & 1 & 77 \\ \hline s6 & & 2 & 88 \\ \hline 57 & & 3 & 92 \\ \hline 58 & & 4 & 94 \\ \hline 54 & 2 years ago & 1 & 84 \\ \hline 60 & & 2 & 77 \\ \hline 61 & & 3 & 104 \\ \hline 62 & & 4 & 98 \\ \hline 63 & last year & 1 & 68 \\ \hline 64 & & 2 & 98 \\ \hline 65 & & 3 & 112 \\ \hline 66 & & 4 & 99 \\ \hline 61 & this year & 1 & 102 \\ \hline 61 & & 2 & 98 \\ \hline 69 & & 3 & 132 \\ \hline 70 & & 4 & 94 \\ \hline 71 & next year & 1 & \\ \hline 73 & & 2 & \\ \hline 73 & & 3 & \\ \hline 34 & & 4 & \\ \hline \end{tabular} \begin{tabular}{|c|c|r|} \hline \multicolumn{2}{|c|}{ Q4 } & \multicolumn{1}{c|}{ Seatonal } \\ \hline Year & Quarter & Demand \\ \hline 3 years ago & 1 & 77 \\ \hline & 2 & 88 \\ \hline & 3 & 92 \\ \hline & 4 & 94 \\ \hline 2 years ago & 1 & 84 \\ \hline & 2 & 77 \\ \hline & 3 & 104 \\ \hline & 4 & 98 \\ \hline tast year & 1 & 68 \\ \hline & 2 & 88 \\ \hline & 3 & 112 \\ \hline & 4 & 99 \\ \hline this year & 1 & 102 \\ \hline & 2 & 98 \\ \hline & 3 & 132 \\ \hline & 4 & 94 \\ \hline next year & 1 & \\ \hline & 2 & \\ \hline & 3 & \\ \hline \end{tabular} A. Generate forecasts for each of the 4 quarters for the next year by using the following 4 forecasting methods. And compute MAD, MSE and RMSE for each of 4 methods. Q1. 5WMA Q2. Exponential Smoothing with Alpha =0.6 Q3. Regression Method (Assume that the data do not contain the seasonal factor). (Use Excel Data Analysis for accuracy and time-saving.) Q4. Regression Method (Assume that the data contain the seasonal factor). \begin{tabular}{|c|c|r|r|} \hline 53 & \multicolumn{2}{|c|}{ Q3 } & \multicolumn{2}{|c|}{ Non-seasonal } \\ \cline { 2 - 4 } & Year & Quarter & Demand \\ \hline 55 & 3 years ago & 1 & 77 \\ \hline s6 & & 2 & 88 \\ \hline 57 & & 3 & 92 \\ \hline 58 & & 4 & 94 \\ \hline 54 & 2 years ago & 1 & 84 \\ \hline 60 & & 2 & 77 \\ \hline 61 & & 3 & 104 \\ \hline 62 & & 4 & 98 \\ \hline 63 & last year & 1 & 68 \\ \hline 64 & & 2 & 98 \\ \hline 65 & & 3 & 112 \\ \hline 66 & & 4 & 99 \\ \hline 61 & this year & 1 & 102 \\ \hline 61 & & 2 & 98 \\ \hline 69 & & 3 & 132 \\ \hline 70 & & 4 & 94 \\ \hline 71 & next year & 1 & \\ \hline 73 & & 2 & \\ \hline 73 & & 3 & \\ \hline 34 & & 4 & \\ \hline \end{tabular} \begin{tabular}{|c|c|r|} \hline \multicolumn{2}{|c|}{ Q4 } & \multicolumn{1}{c|}{ Seatonal } \\ \hline Year & Quarter & Demand \\ \hline 3 years ago & 1 & 77 \\ \hline & 2 & 88 \\ \hline & 3 & 92 \\ \hline & 4 & 94 \\ \hline 2 years ago & 1 & 84 \\ \hline & 2 & 77 \\ \hline & 3 & 104 \\ \hline & 4 & 98 \\ \hline tast year & 1 & 68 \\ \hline & 2 & 88 \\ \hline & 3 & 112 \\ \hline & 4 & 99 \\ \hline this year & 1 & 102 \\ \hline & 2 & 98 \\ \hline & 3 & 132 \\ \hline & 4 & 94 \\ \hline next year & 1 & \\ \hline & 2 & \\ \hline & 3 & \\ \hline \end{tabular} A. Generate forecasts for each of the 4 quarters for the next year by using the following 4 forecasting methods. And compute MAD, MSE and RMSE for each of 4 methods. Q1. 5WMA Q2. Exponential Smoothing with Alpha =0.6 Q3. Regression Method (Assume that the data do not contain the seasonal factor). (Use Excel Data Analysis for accuracy and time-saving.) Q4. Regression Method (Assume that the data contain the seasonal factor)


