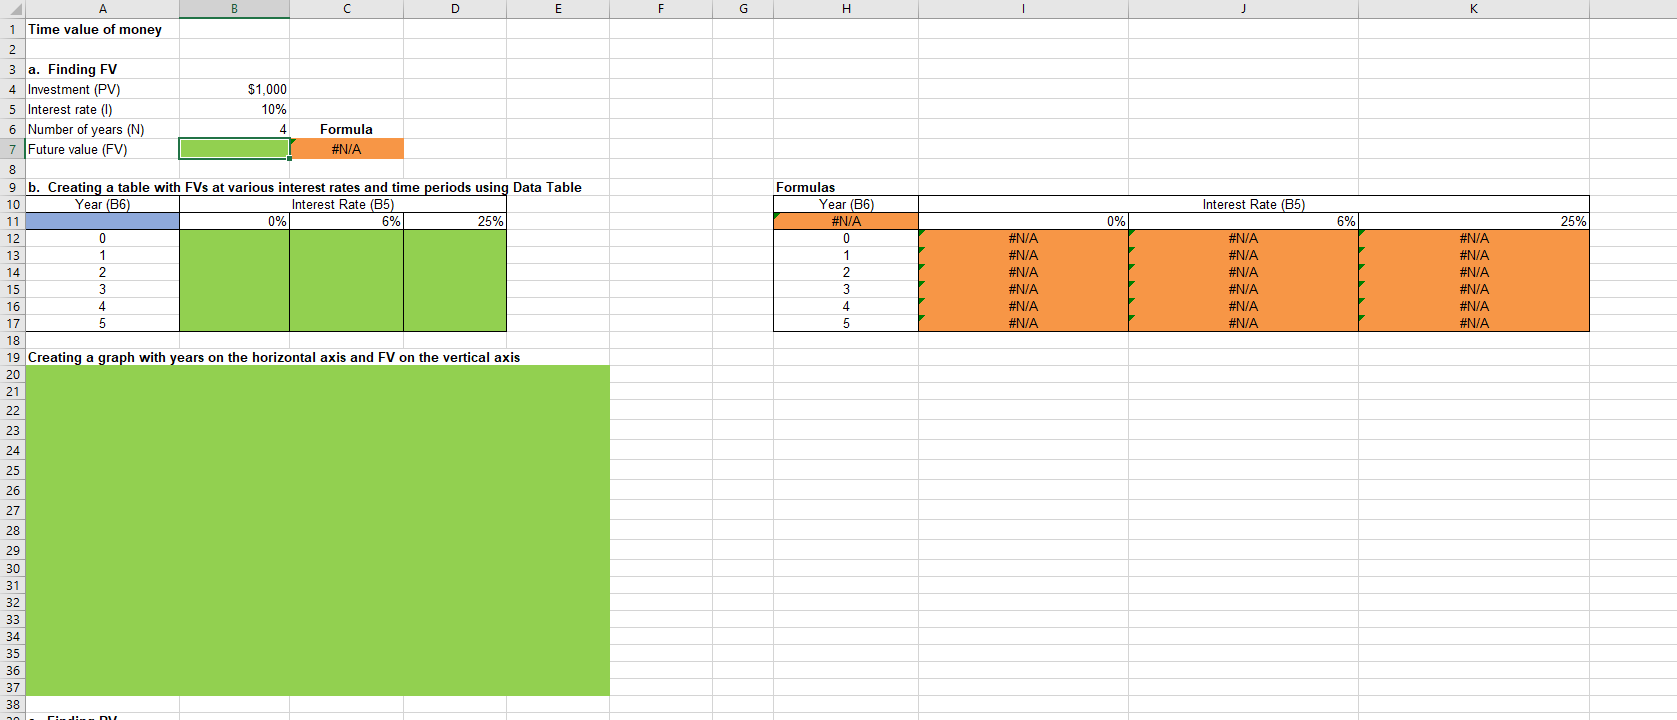
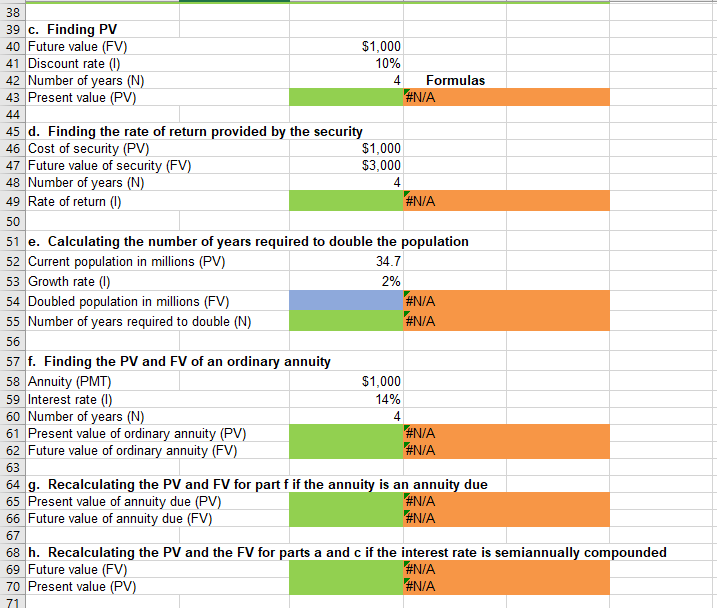
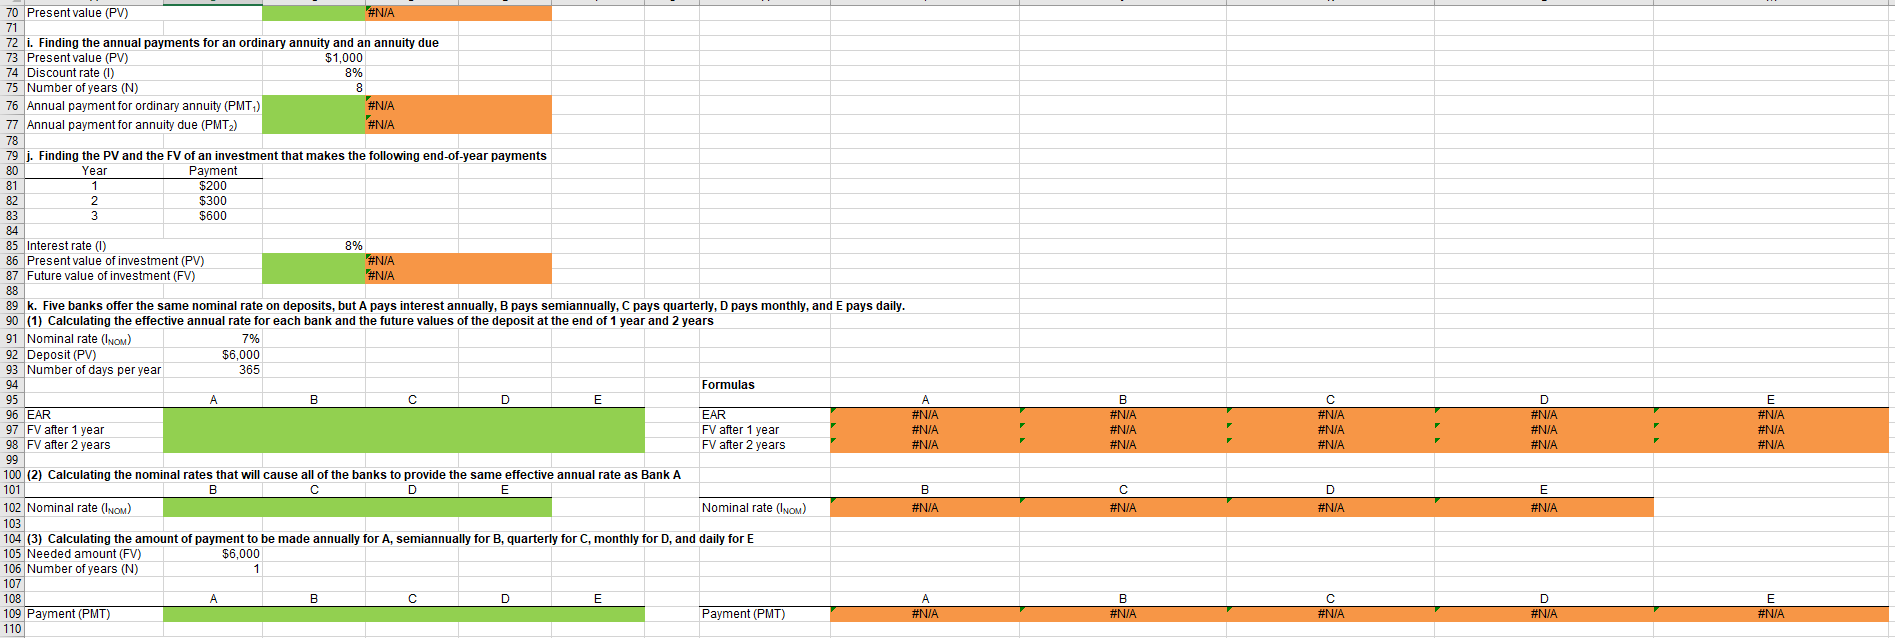
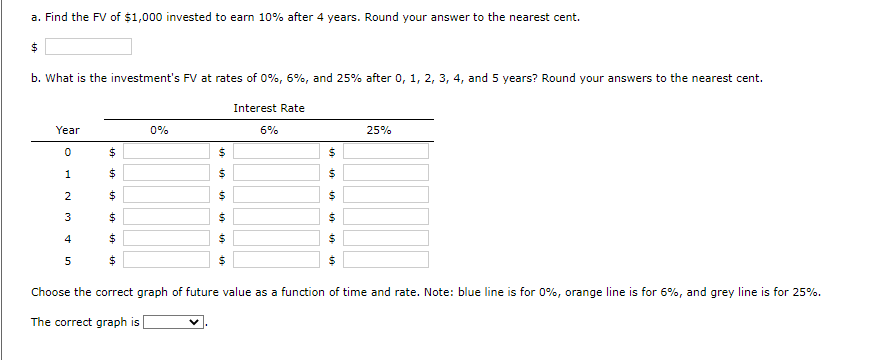
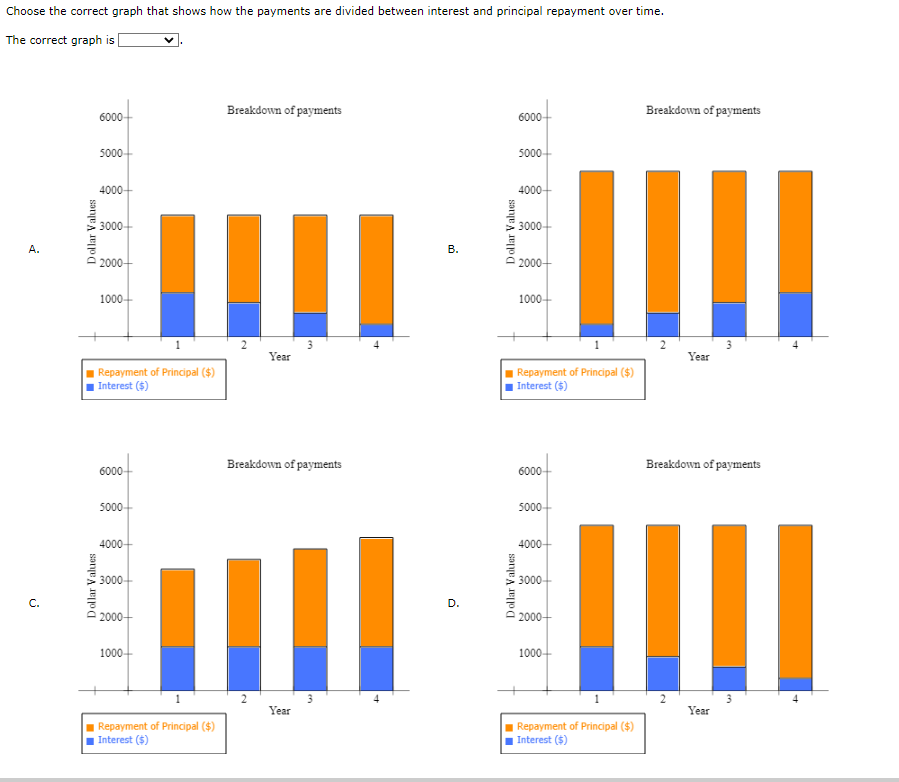
\begin{tabular}{l|l} 38 & \\ \hline 39 & c. Finding PV \end{tabular} 40 Future value (FV) 41 Discount rate (l) 42 Number of years (N) 4 Formulas 43 Present value (PV) 44 45 d. Finding the rate of return provided by the security 51 e. Calculating the number of years required to double the population \begin{tabular}{l|l|r|} 52 & Current population in millions (PV) & 34.7 \\ \hline 53 & Growth rate (I) & 2% \\ \hline 54 & Doubled population in millions (FV) & \#N/A \\ 55 & Number of years required to double (N) & \#N/A \end{tabular} 56 57 f. Finding the PV and FV of an ordinary annuity 58 Annuity (PMT) 59 Interest rate (I) 60 Number of years (N) 61 Present value of ordinary annuity (PV) 62 Future value of ordinary annuity (FV) 63 64 g. Recalculating the PV and FV for part f if the annuity is an annuity due 65 Present value of annuity due (PV) \#N/A 66 Future value of annuity due (FV) 67 68 h. Recalculating the PV and the FV for parts a and c if the interest rate is semiannually compounded 69 Future value (FV) \#N/A 70 Present value (PV) \#N/A a. Find the FV of $1,000 invested to earn 10% after 4 years. Round your answer to the nearest cent. $ b. What is the investment's FV at rates of 0%,6%, and 25% after 0,1,2,3,4, and 5 years? Round your answers to the nearest cent. Choose the correct graph of future value as a function of time and rate. Note: blue line is for 0%, orange line is for 6%, and grey line is for 25%. The correct graph is c. Find the PV of $1,000 due in 4 years if the discount rate is 10%. Round your answer to the nearest cent. $ d. A security has a cost of $1,000 and will return $3,000 after 4 years. What rate of return does the security provide? Round your answer to two decimal places. % years PV of ordinary annuity: $ FV of ordinary annuity: $ g. How will the PV and FV of the annuity in part f change if it is an annuity due rather than an ordinary annuity? Round your answers to the nearest cent. PV of annuity due: $ FV of annuity due: $ FV with semiannual compounding: $ PV with semiannual compounding: $ i. Find the annual payments for an ordinary annuity and an annuity due for 8 years with a PV of $1,000 and an interest rate of 8%. Round your answers to the nearest cent. Annual payment for ordinary annuity: $ Annual payment for annuity due: $ j. Find the PV and the FV of an investment that makes the following end-of-year payments. The interest rate is 8%. Round your answers to the nearest cent. PV of investment: $ FV of investment: $ PV of investment: $ FV of investment: $ to each bank? Round your answers to the nearest cent. 4. Even if the five banks provided the same effective annual rate, would a rational investor be indifferent between the banks? It is more likely that an investor would prefer the bank that compounded frequently. answers to the nearest cent. If your answer is zero, enter " 0 ". Choose the correct graph that shows how the payments are divided between interest and principal repayment over time. The correct graph is Choose the correct graph that shows how the payments are divided between interest and principal repayment over time. \begin{tabular}{l|l} 38 & \\ \hline 39 & c. Finding PV \end{tabular} 40 Future value (FV) 41 Discount rate (l) 42 Number of years (N) 4 Formulas 43 Present value (PV) 44 45 d. Finding the rate of return provided by the security 51 e. Calculating the number of years required to double the population \begin{tabular}{l|l|r|} 52 & Current population in millions (PV) & 34.7 \\ \hline 53 & Growth rate (I) & 2% \\ \hline 54 & Doubled population in millions (FV) & \#N/A \\ 55 & Number of years required to double (N) & \#N/A \end{tabular} 56 57 f. Finding the PV and FV of an ordinary annuity 58 Annuity (PMT) 59 Interest rate (I) 60 Number of years (N) 61 Present value of ordinary annuity (PV) 62 Future value of ordinary annuity (FV) 63 64 g. Recalculating the PV and FV for part f if the annuity is an annuity due 65 Present value of annuity due (PV) \#N/A 66 Future value of annuity due (FV) 67 68 h. Recalculating the PV and the FV for parts a and c if the interest rate is semiannually compounded 69 Future value (FV) \#N/A 70 Present value (PV) \#N/A a. Find the FV of $1,000 invested to earn 10% after 4 years. Round your answer to the nearest cent. $ b. What is the investment's FV at rates of 0%,6%, and 25% after 0,1,2,3,4, and 5 years? Round your answers to the nearest cent. Choose the correct graph of future value as a function of time and rate. Note: blue line is for 0%, orange line is for 6%, and grey line is for 25%. The correct graph is c. Find the PV of $1,000 due in 4 years if the discount rate is 10%. Round your answer to the nearest cent. $ d. A security has a cost of $1,000 and will return $3,000 after 4 years. What rate of return does the security provide? Round your answer to two decimal places. % years PV of ordinary annuity: $ FV of ordinary annuity: $ g. How will the PV and FV of the annuity in part f change if it is an annuity due rather than an ordinary annuity? Round your answers to the nearest cent. PV of annuity due: $ FV of annuity due: $ FV with semiannual compounding: $ PV with semiannual compounding: $ i. Find the annual payments for an ordinary annuity and an annuity due for 8 years with a PV of $1,000 and an interest rate of 8%. Round your answers to the nearest cent. Annual payment for ordinary annuity: $ Annual payment for annuity due: $ j. Find the PV and the FV of an investment that makes the following end-of-year payments. The interest rate is 8%. Round your answers to the nearest cent. PV of investment: $ FV of investment: $ PV of investment: $ FV of investment: $ to each bank? Round your answers to the nearest cent. 4. Even if the five banks provided the same effective annual rate, would a rational investor be indifferent between the banks? It is more likely that an investor would prefer the bank that compounded frequently. answers to the nearest cent. If your answer is zero, enter " 0 ". Choose the correct graph that shows how the payments are divided between interest and principal repayment over time. The correct graph is Choose the correct graph that shows how the payments are divided between interest and principal repayment over time