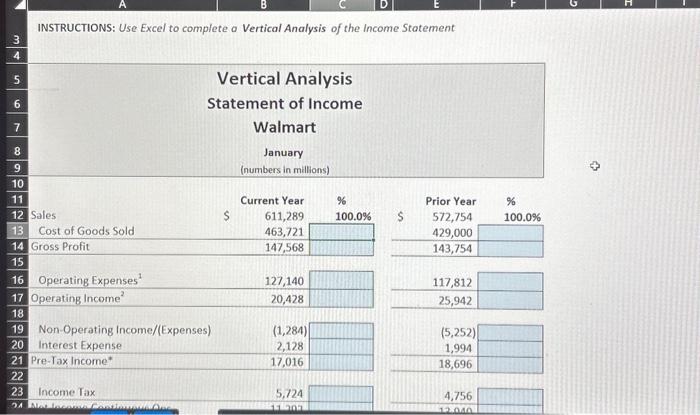
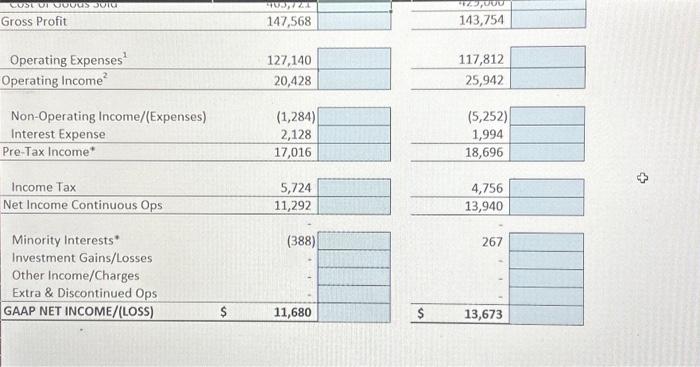
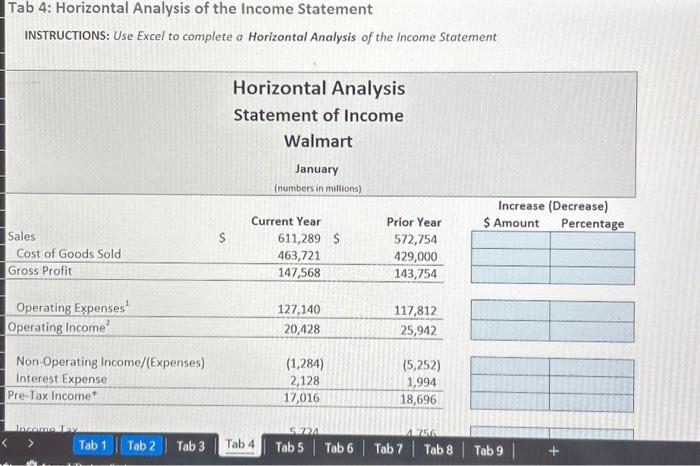
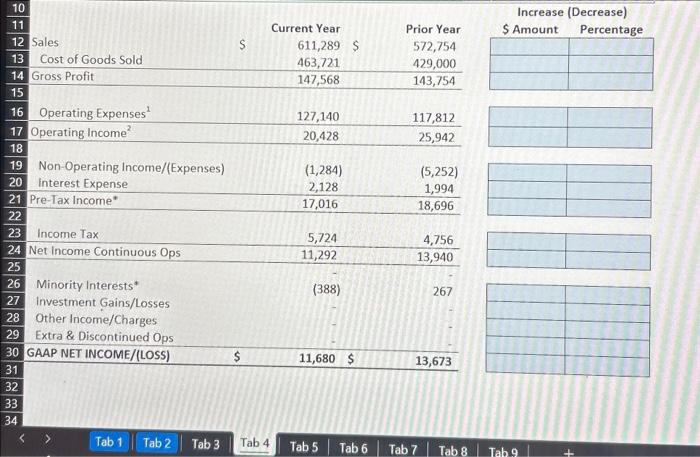
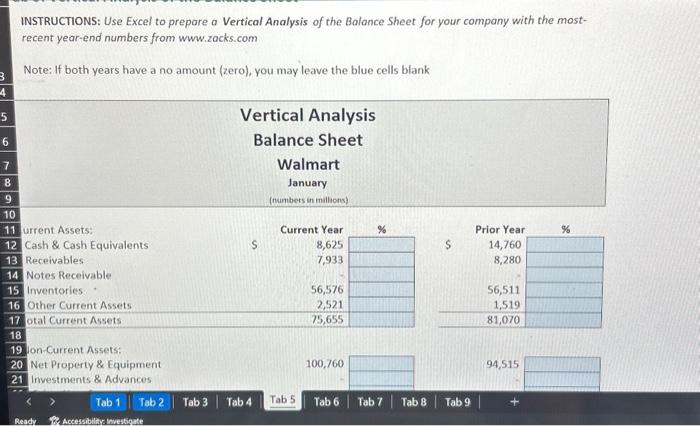
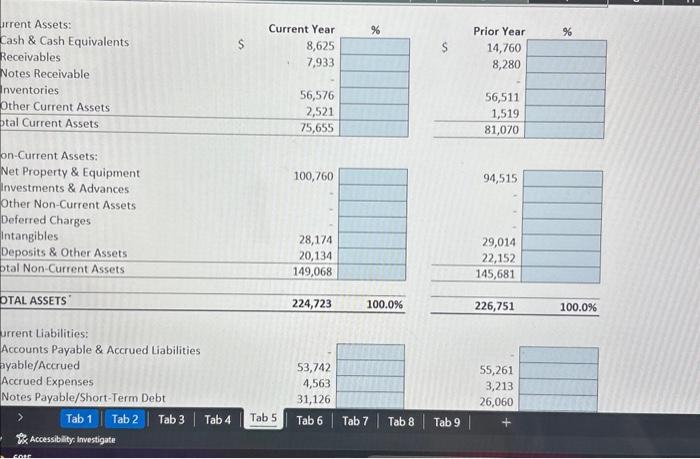
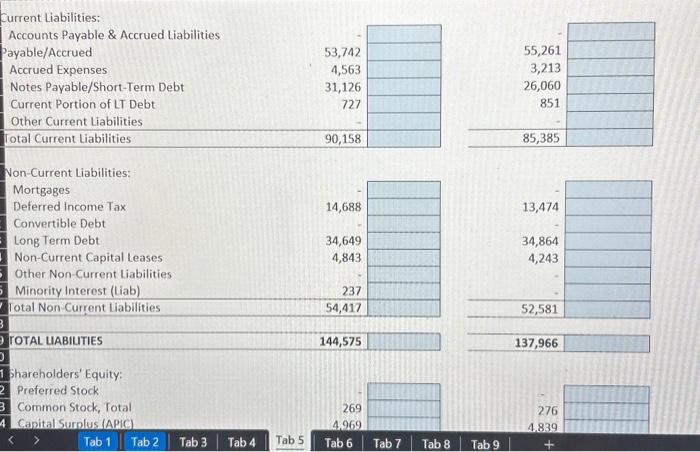
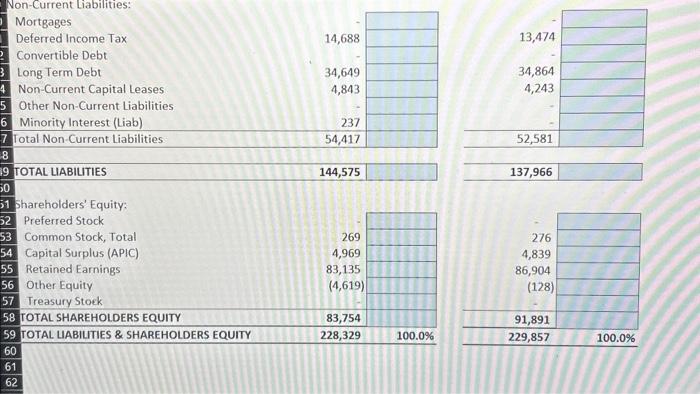
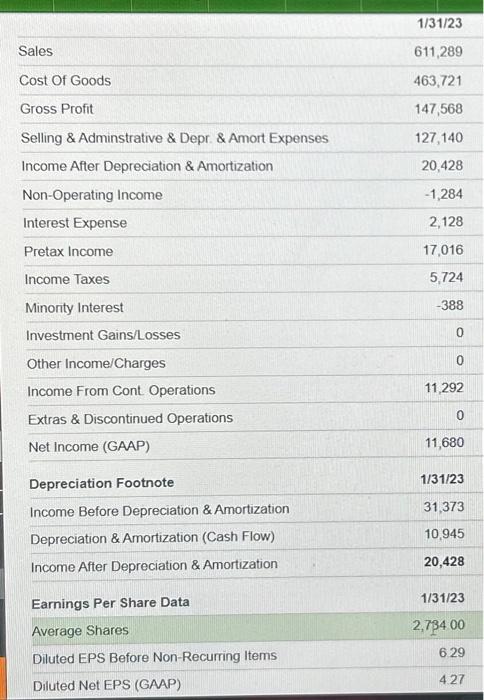
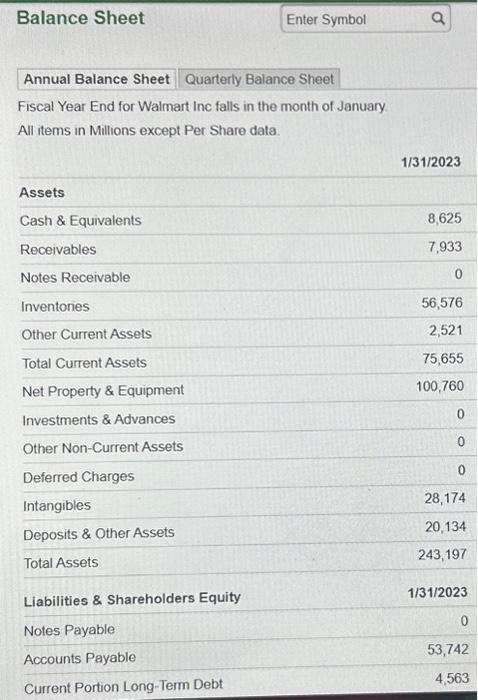
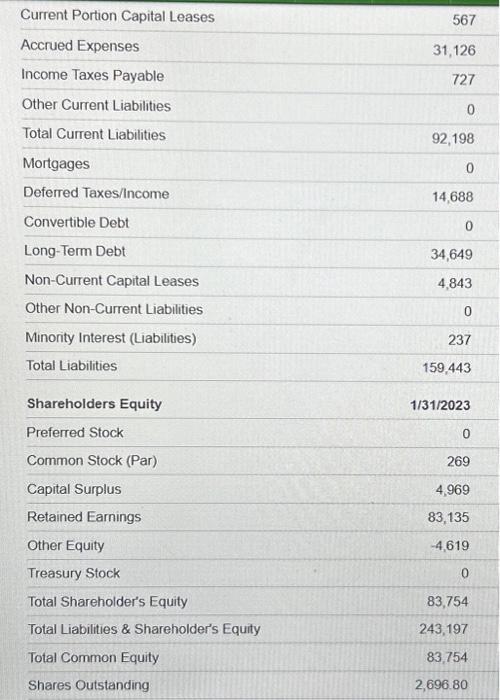
\begin{tabular}{lr} \hline Sales & 1/31/23 \\ \hline Cost Of Goods & 611,289 \\ \hline Gross Profit & 463,721 \\ \hline Selling \& Adminstrative \& Depr. \& Amort Expenses & 147,568 \\ \hline Income After Depreciation \& Amortization & 127,140 \\ \hline Non-Operating Income & 20,428 \\ \hline Interest Expense & 1,284 \\ \hline Pretax Income & 2,128 \\ \hline Income Taxes & 17,016 \\ \hline Minority Interest & 5,724 \\ \hline Investment Gains/Losses & -388 \\ \hline Other Income/Charges & 0 \\ \hline Income From Cont Operations & 11,292 \\ \hline Extras \& Discontinued Operations & 0 \\ \hline Net Income (GAAP) & 11,680 \\ \hline Depreciation Footnote & 1/31/23 \\ \hline Income Before Depreciation \&Amortization & 31,373 \\ \hline Depreciation \& Amortization (Cash Flow) & 10,945 \\ \hline Income After Depreciation \& Amortization & 20,428 \\ \hline Earnings Per Share Data & 1/31/23 \\ \hline Average Shares & 2,73400 \\ \hline Diluted EPS Before Non-Recurring Items & 6229 \\ \hline Diluted Net EPS (GAAP) & 4.27 \\ \hline \end{tabular} Tab 4: Horizontal Analysis of the Income Statement INSTRUCTIONS: Use Excel to complete a Horizontal Analysis of the Income Statement furrent Liabilities: Accounts Payable \& Accrued Liabilities Payable/Accrued Accrued Expenses Notes Payable/Short-Term Debt Current Portion of LT Debt Non-Current Liabilities: Mortgages Deferred Income Tax TOTAL UABILITIES 144,575 137,966 Shareholders' Equity: Preferred Stock Common Stock, Total 4 Canital Surnlus (APIC) 269 4.969 276 4.839 Tab 1 Tab 2 Tab 6 Tab 7 Tab 8 Tab 9 INSTRUCTIONS: Use Excel to prepare a Vertical Analysis of the Balance Sheet for your company with the mostrecent year-end numbers from www.zacks.com Note: If both years have a no amount (zero), you may leave the blue cells blank INSTRUCTIONS: Use Excel to complete a Vertical Analysis of the Income Statement irrent Assets: Cash \& Cash Equivalents Receivables Notes Receivable nventories Other Current Assets tal Current Assets on-Current Assets: Net Property \& Equipment Investments \& Advances Other Non-Current Assets Deferred Charges Intangibles Deposits \& Other Assets ptal Non-Current Assets OTAL ASSETS Current Year % 8,625 7,933 56,576 2,521 \begin{tabular}{|l|} \hline \\ \\ \( {\hline} \\ {\hline} \\ {\hline} \) \end{tabular} \begin{tabular}{|r|r|} \hline 100,760 & \\ \hline & \\ \hline 28,174 & \\ 20,134 & \\ 149,068 & \\ \hline \end{tabular} 224,723 \begin{tabular}{ll} \hline 226,751 & 100.0% \\ \hline \end{tabular} urrent Liabilities: Accounts Payable \& Accrued Liabilities ayable/Accrued Accrued Expenses Notes Payable/Short-Term Debt Tab 1 Tab 2 Tab 3 Tab 4 Tab 5 Tab 6 Tab 7 Tab 8 Tab 9 \begin{tabular}{lr} \hline Current Portion Capital Leases & 567 \\ \hline Accrued Expenses & 31,126 \\ \hline Income Taxes Payable & 727 \\ \hline Other Current Liabilities & 0 \\ \hline Total Current Liabilities & 92,198 \\ \hline Mortgages & 0 \\ \hline Deferred Taxes/lncome & 14,688 \\ \hline Convertible Debt & 0 \\ \hline Long-Term Debt & 34,649 \\ \hline Non-Current Capital Leases & 4,843 \\ \hline Other Non-Current Liabilities & 0 \\ \hline Minority Interest (Liabilities) & 237 \\ \hline Total Liabilities & 159,443 \\ \hline Shareholders Equity & 1/31/2023 \\ \hline Preferred Stock & 0 \\ \hline Common Stock (Par) & 269 \\ \hline Capital Surplus & 4,969 \\ \hline Retained Earnings & 83,135 \\ \hline Other Equity & 4,619 \\ \hline Treasury Stock & 03,754 \\ \hline Total Shareholder's Equity & 243,197 \\ \hline Total Liabilities \& Shareholder's Equity & 83,754 \\ \hline Total Common Equity & 2,696.80 \\ \hline Shares Outstanding & 0 \\ \hline \end{tabular} Increase (Decrease) Non-Current Liabilities: Mortgages Deferred Income Tax Convertible Debt Long Term Debt Non-Current Capital Leases 14,688 \begin{tabular}{|l|l|} \hline & \\ \hline & \\ \hline & \\ \hline & \\ \hline & \\ \hline & \\ \hline \end{tabular} Other Non-Current Liabilities 34,649 Minority Interest (Liab) 4,843 Total Non-Current Liabilities 54,417 52,581 TOTAL LIABIUTIES 144,575 137,966 Shareholders' Equity: Preferred Stock. Common Stock, Total Capital Surplus (APIC) Retained Earnings Other Equity 269 \begin{tabular}{|l|} \hline \\ \hline \\ \hline \\ \hline \\ \hline \end{tabular} Treasury Stoek TOTAL SHAREHOLDERS EQUITY 4,969 83,135 (4,619) TOTAL UIABIUTIES \& SHAREHOLDERS EQUITY 83,754 276 4,839 86,904 (128) 91,891 228,329100.0% 229,857 100.0% Fiscal Year End for Walmart Inc falls in the month of January All items in Millions except Per Share data. \begin{tabular}{r|r|} \hline 143,754 & \\ \hline \end{tabular} \begin{tabular}{r|r|} \\ \hline 25,942 \\ \end{tabular} \begin{tabular}{|lr|r|} Non-Operating Income/(Expenses) & (1,284) & \\ Interest Expense & 2,128 & \\ \hline Pre-Tax Income & 17,016 & \\ \hline \end{tabular} \begin{tabular}{r|r|} (5,252) & \\ 1,994 & \\ \hline 18,696 & \\ \hline \end{tabular} \begin{tabular}{|lr|r|} \hline Income Tax & 5,724 & \\ \hline Net Income Continuous Ops & 11,292 & \\ \hline \end{tabular} \begin{tabular}{r|r|} \hline 4,756 & \\ \hline 13,940 & \\ \hline \end{tabular} Minority Interests * Investment Gains/Losses Other Income/Charges Extra \& Discontinued Ops (388) 267
