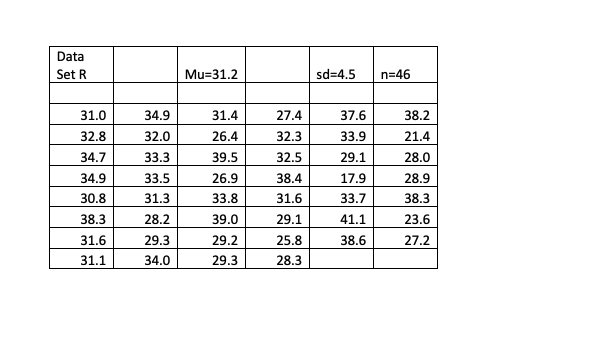
\begin{tabular}{|r|r|r|r|r|r|} \hline \multicolumn{1}{|l|}{DataSetR} & & Mu=31.2 & & sd=4.5 & n=46 \\ \hline & & & & & \\ \hline 31.0 & 34.9 & 31.4 & 27.4 & 37.6 & 38.2 \\ \hline 32.8 & 32.0 & 26.4 & 32.3 & 33.9 & 21.4 \\ \hline 34.7 & 33.3 & 39.5 & 32.5 & 29.1 & 28.0 \\ \hline 34.9 & 33.5 & 26.9 & 38.4 & 17.9 & 28.9 \\ \hline 30.8 & 31.3 & 33.8 & 31.6 & 33.7 & 38.3 \\ \hline 38.3 & 28.2 & 39.0 & 29.1 & 41.1 & 23.6 \\ \hline 31.6 & 29.3 & 29.2 & 25.8 & 38.6 & 27.2 \\ \hline 31.1 & 34.0 & 29.3 & 28.3 & & \\ \hline \end{tabular} 1. The data values and relevant information are posted in the course website. Use the data set (P,Q,R,S, or T) assigned to you by your instructor to complete this application. For the purpose of this application, treat the data set as if it represented a certain random variable and was a valid random sample gathered by a researcher from a normally distributed population. The sample data was actually found with an online Gaussian random number generator that creates normally distributed data values. The random number generator simulates the results of a researcher finding those values through observation or experimentation. 2. Use technology (Excel, graphing calculator, etc.) to sort the sample data values from low to high. Use Excel or similar software to put the data into a table with about 5 or 6 columns. Label this "Table 1: Sorted Set of Sample Data." 3. Using 5 to 10 class intervals, organize the sample data as a frequency distribution in a table. The intervals of the frequency distribution should be rounded to the tenths so that they match the data. Label this "Table 2: Frequency Distribution." 4. Use Excel (or similar software) to construct a frequency histogram to illustrate the data. Give the axes the proper titles. Label this "Graph 1: Histogram." 5. Use Table 2, the frequency distribution, to find the midpoints of each class interval. Create a new frequency distribution with the midpoints in the left column and the frequencies in the right column. Label this "Table 3: Frequency Distribution with Midpoints." 6. Use technology to find the mean, median, standard deviation, and variance of the sample data organized in Table 3 (from step 5 above). Put these values into a table with the proper symbol in the left column and the value of the statistic in the right column. Also, from the original data set, put the values of the range and sample size in the table. The median and range do not generally have symbols so the terms "Median" and "Range" can be used in the left column. Identify the modal class (the one with the highest frequency). Put the terms "Modal Class" in the left column and the class interval in the right column. The statistics should be rounded properly (one more decimal place than the data). Label this "Table 4: Summary Statistics" 7. Use the sample mean and standard deviation to find the values related to the Empirical Rule. The Empirical Rule: For a set of data whose distribution is approximately normal, - about 68% of the data are within one standard deviation of the mean. - about 95\% of the data are within two standard deviations of the mean. - about 99.7% of the data are within three standard deviations of the mean. Use the value of n and the percents listed above to find how many data values should be withir each category. Then use the sample mean and standard deviation to find the lower and upper cut-off values in each category. Then use the sorted list of data to determine how many values are actually in each category. Put the values into a table as shown in the example and label it