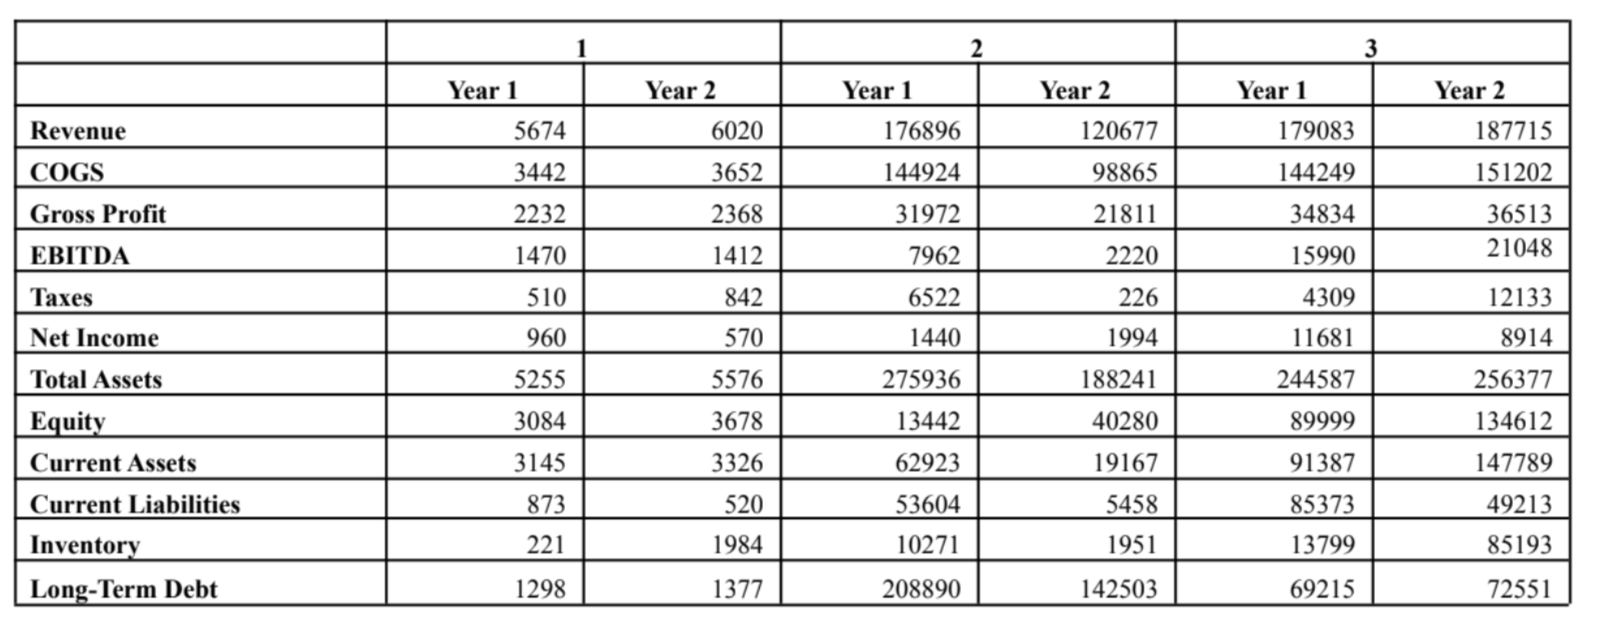
Below are balance sheet and income numbers for three companies. Answer the questions below.


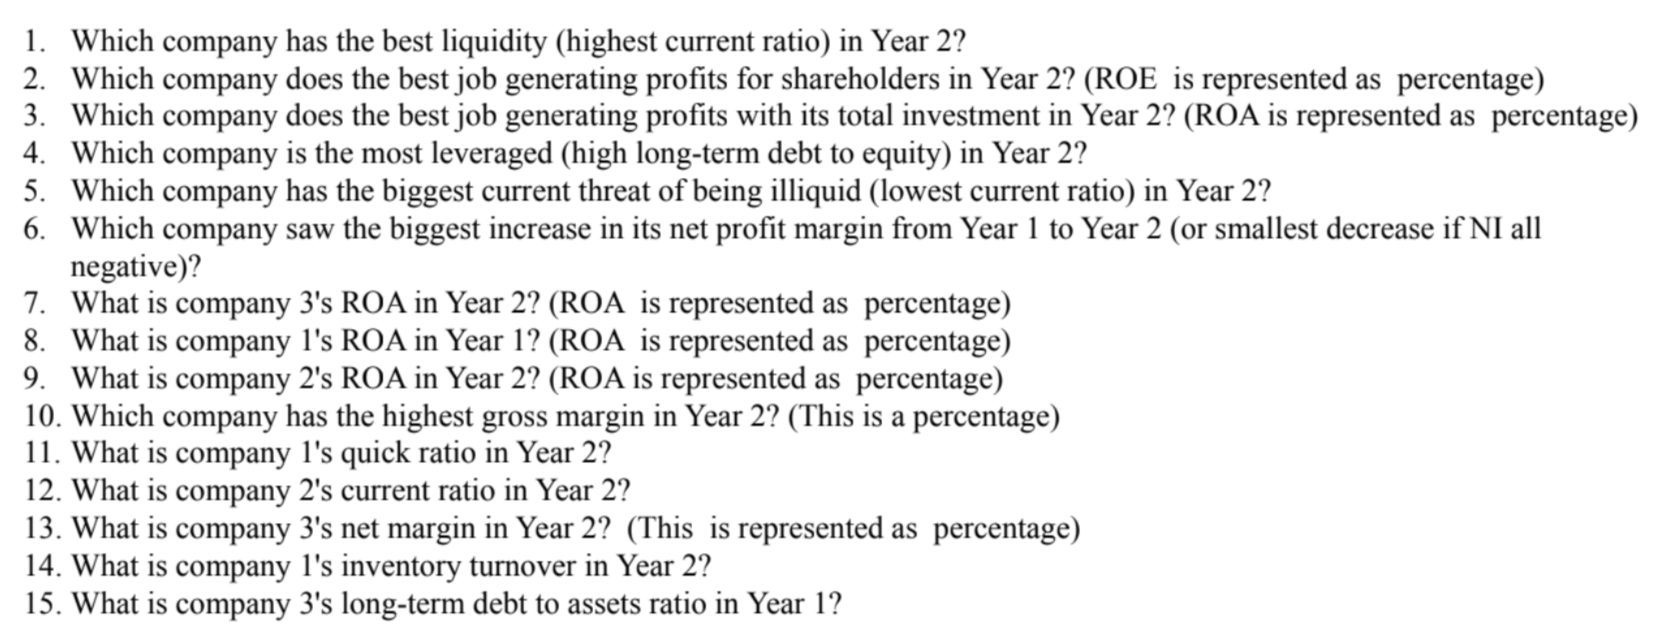
Rules of Play - The balance sheet items may not balance perfectly (they may be out $1 ) due to rounding error. - USE EXCEL to calculate the solutions and do the math - calculators may throw off your rounding. - You will be asked to submit the sheet you used to solve the homework. If you don't submit an excel sheet that has the problem set in it, it will not be graded. - If you use Google Sheets - download the file as an Excel attachment and submit that. Do not submit a Google Shheet - they can be changed after submission which creates grading transparency problems. - Submit percentages as the percentage followed by two decimals. A number that appears as .04567 in Excel should be submitted as 4.57%. - Responses will be marked correct if they are within 5\% of the answer I calculated in Excel 1. Which company has the best liquidity (highest current ratio) in Year 2 ? 2. Which company does the best job generating profits for shareholders in Year 2 ? (ROE is represented as percentage) 3. Which company does the best job generating profits with its total investment in Year 2 ? (ROA is represented as percentage) 4. Which company is the most leveraged (high long-term debt to equity) in Year 2 ? 5. Which company has the biggest current threat of being illiquid (lowest current ratio) in Year 2? 6. Which company saw the biggest increase in its net profit margin from Year 1 to Year 2 (or smallest decrease if NI all negative)? 7. What is company 3 's ROA in Year 2 ? (ROA is represented as percentage) 8. What is company 1 's ROA in Year 1 ? (ROA is represented as percentage) 9. What is company 2's ROA in Year 2? (ROA is represented as percentage) 10. Which company has the highest gross margin in Year 2? (This is a percentage) 11. What is company 1's quick ratio in Year 2? 12. What is company 2's current ratio in Year 2? 13. What is company 3 's net margin in Year 2? (This is represented as percentage) 14. What is company 1's inventory turnover in Year 2? 15. What is company 3 's long-term debt to assets ratio in Year 1 ? Rules of Play - The balance sheet items may not balance perfectly (they may be out $1 ) due to rounding error. - USE EXCEL to calculate the solutions and do the math - calculators may throw off your rounding. - You will be asked to submit the sheet you used to solve the homework. If you don't submit an excel sheet that has the problem set in it, it will not be graded. - If you use Google Sheets - download the file as an Excel attachment and submit that. Do not submit a Google Shheet - they can be changed after submission which creates grading transparency problems. - Submit percentages as the percentage followed by two decimals. A number that appears as .04567 in Excel should be submitted as 4.57%. - Responses will be marked correct if they are within 5\% of the answer I calculated in Excel 1. Which company has the best liquidity (highest current ratio) in Year 2 ? 2. Which company does the best job generating profits for shareholders in Year 2 ? (ROE is represented as percentage) 3. Which company does the best job generating profits with its total investment in Year 2 ? (ROA is represented as percentage) 4. Which company is the most leveraged (high long-term debt to equity) in Year 2 ? 5. Which company has the biggest current threat of being illiquid (lowest current ratio) in Year 2? 6. Which company saw the biggest increase in its net profit margin from Year 1 to Year 2 (or smallest decrease if NI all negative)? 7. What is company 3 's ROA in Year 2 ? (ROA is represented as percentage) 8. What is company 1 's ROA in Year 1 ? (ROA is represented as percentage) 9. What is company 2's ROA in Year 2? (ROA is represented as percentage) 10. Which company has the highest gross margin in Year 2? (This is a percentage) 11. What is company 1's quick ratio in Year 2? 12. What is company 2's current ratio in Year 2? 13. What is company 3 's net margin in Year 2? (This is represented as percentage) 14. What is company 1's inventory turnover in Year 2? 15. What is company 3 's long-term debt to assets ratio in Year 1


