

Answered step by step
Verified Expert Solution
Question
1 Approved Answer
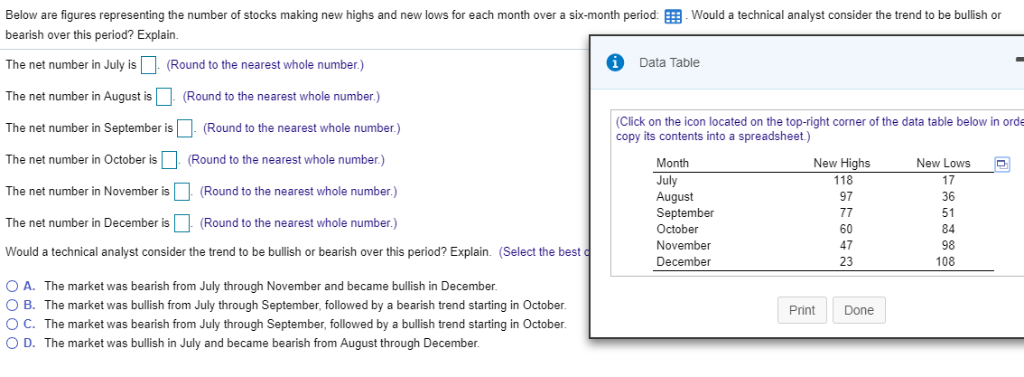
Below are figures representing the number of stocks making new highs and new lows for each month over a six-month periodwould a technical analyst consider
Step by Step Solution
There are 3 Steps involved in it
Step: 1

Get Instant Access to Expert-Tailored Solutions
See step-by-step solutions with expert insights and AI powered tools for academic success
Step: 2

Step: 3
Ace Your Homework with AI
Get the answers you need in no time with our AI-driven, step-by-step assistance
Get Started
Financial Markets Of Eastern Europe And The Former Soviet Union
Authors: François Perquel
1st Edition
1855733404,1782420002