

Question
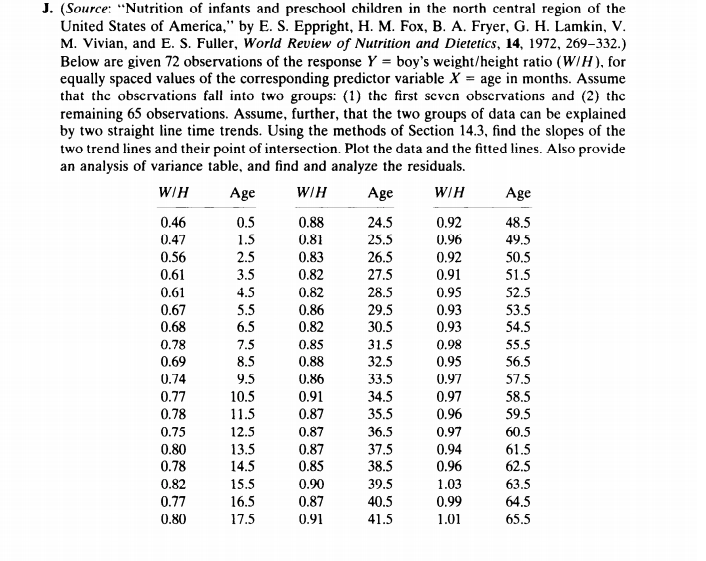
Below are given 72 observations of the response Y = boy's weight/height ratio, for equally spaced values of the corresponding predictor variable X = age
Below are given 72 observations of the response Y = boy's weight/height ratio, for equally spaced values of the corresponding predictor variable X = age in months. Solve the following question and show your process.
Step by Step Solution
There are 3 Steps involved in it
Step: 1

Get Instant Access to Expert-Tailored Solutions
See step-by-step solutions with expert insights and AI powered tools for academic success
Step: 2

Step: 3
Ace Your Homework with AI
Get the answers you need in no time with our AI-driven, step-by-step assistance
Get Started
Business Analytics Data Analysis and Decision Making
Authors: S. Christian Albright, Wayne L. Winston
5th edition
1133629601, 9781285965529 , 978-1133629603