

Question
Below are the snippets of Income Statement, Balance Sheet, and Cash Flow. I need the following ratios and how to get them from the information
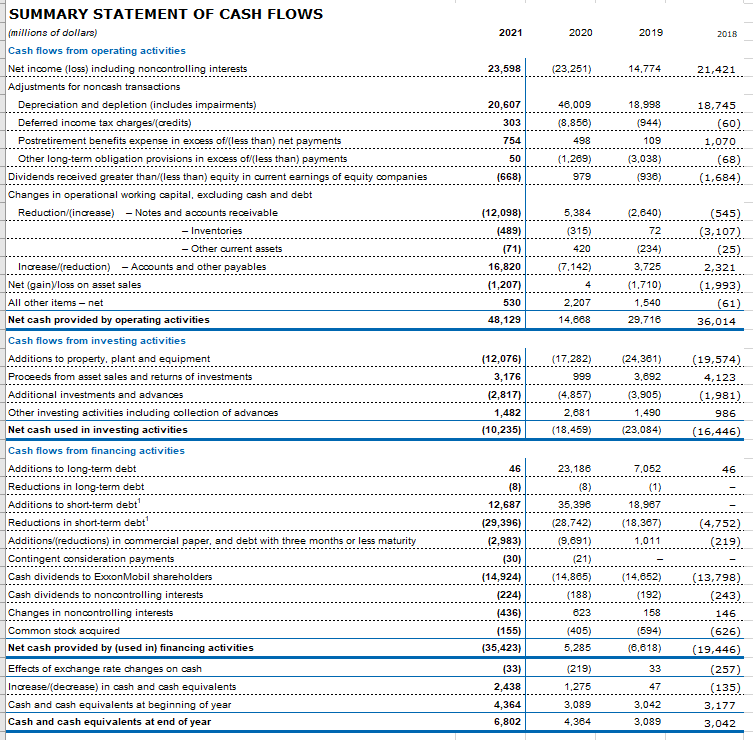
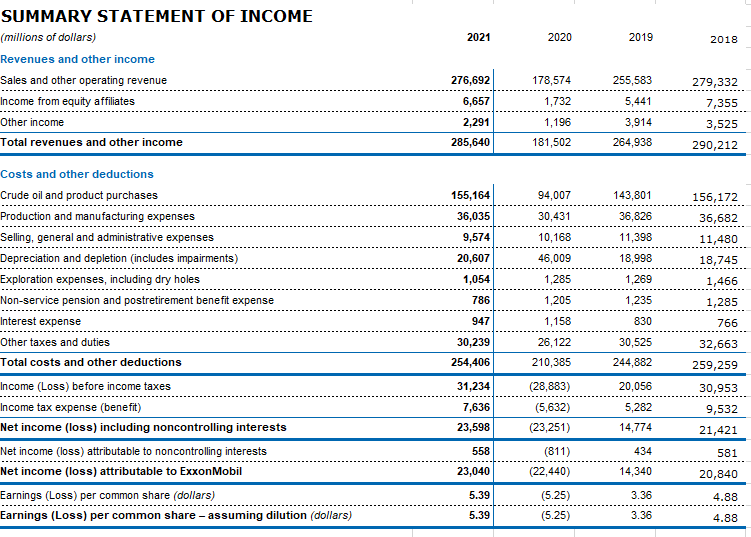
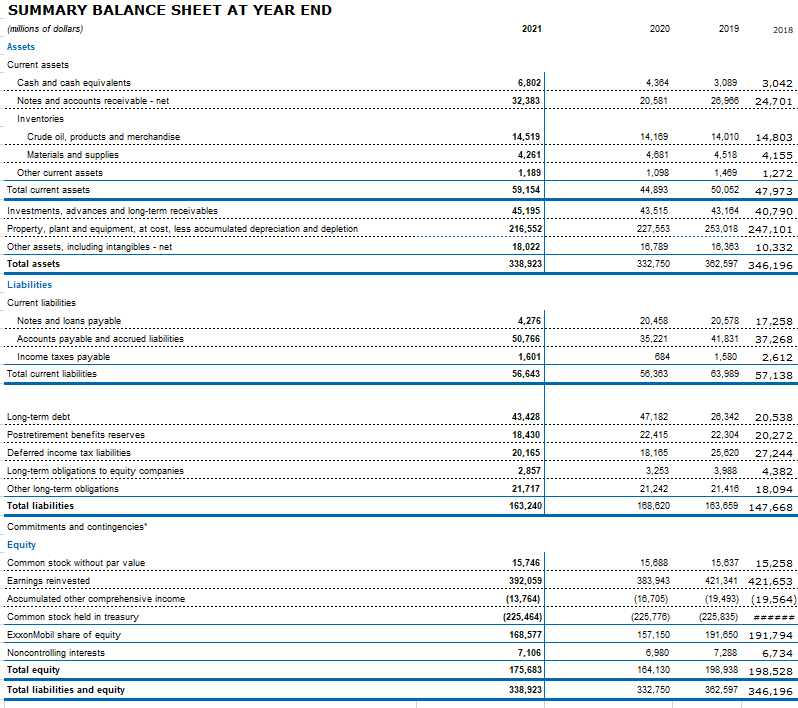
Below are the snippets of Income Statement, Balance Sheet, and Cash Flow.
I need the following ratios and how to get them from the information provided.
Current Ratio, Quick Ratio, Debt-to-assets, debt-to-equity, market debt, liabilities to assets, equity multiplier, TIE ratio, EBITDA Coverage ratio, P/E ratio, P/FCF Ratio, Price/EBITDA Ratio, Book value per share, M/B Ratio, Market Capitalization.
Thanks in advance.
 SUMMARY STATEMENT OF CASH FLOWS (millions of dollars) 2021 2020 2019 2018 Cash flows from operating activities Net income (loss) including noncontrolling interests Adjustments for noncash transactions Depreciation and depletion (includes impairments) Deferred income tax charges/(credits) Postretirement benefits expense in excess of/(less than) net payments Other long-term obligation provisions in excess of/(less than) payments Dividends received greater than/(less than) equity in current earnings of equity companies Changes in operational working capital, excluding cash and debt Reduction/(increase) - Notes and accounts receivable 23,598 (23,251) 14,774 21,421 - Inventories - Other current assets Increase/(reduction) - Accounts and other payables Net (gain)loss on asset sales All other items - net 20,607 46,009 18,998 18,745 303 (8,856) (60) 109 498 (1,289) (3,038) (68) 979 (936) (1,684) Net cash provided by operating activities [12,098) 5,384 (545) (489) (315) (2,640) (3,107) (25) 234) (7,142) 3,725 2,321 Cash flows from investing activities Additions to property. plant and equipment Proceeds from gsset sales and returns of investments Additional investments and advances Other investing activities including collection of advances Net cash used in investing activities [1,207) (1,710)(1,993) 530 4 48,129 2,207 1,540 (61) Cash flows from financing activities Additions to long-term debt Reductions in long-term debt Additions to short-term debt 1 Reductions in short-term debt 1 Additions/(reductions) in commercial paper, and debt with three months or less maturity Contingent consideration payments (12,076) (17,282) (24,361) (19,574) 3,176 999 3,692 4,123 (2,817)(4,857)(3,905)(1,981) Cash dividends to ExxonMobil shareholders [10,235} 2,681 (23,084)(16,446) Cash dividends to noncontrolling interests Changes in noncontrolling interests Common stook acquired 46 23,186 7,052 (8) (8) (1) 35,398 18,987 Net cash provided by (used in) financing activities (28,742) (18,367) (4,752) Effects of exchange rate changes on cash Increase/(decrease) in cash and cash equivalents Cash and cash equivalents at beginning of year Cash and cash equivalents at end of year (29,396) (9,691) 1,011 (219) (21) (14,865) (14,652) (13,798) (188) (192) (243) 623 158 146 (405) (594) (626) (35,423) 5,285 (6,618) (19,446) (219) \begin{tabular}{cc} 33 & (257) \\ \hline 47 & (135) \\ \hline 3,042 & 3,177 \\ \hline 3,089 & 3,042 \\ \hline \end{tabular} cash and cash equivaients at end or year ar SUMMARY STATEMENT OF INCOME (millions of dollars) 2021 2020 2019 2018 Revenues and other income Costs and other deductions Crude oil and product purchases Production and manufacturing expenses Selling, general and administrative expenses Depreciation and depletion (includes impairments) Exploration expenses, including dry holes Non-service pension and postretirement benefit expense Interest expense Other taxes and duties Total costs and other deductions Income (Loss) before income taxes Income tax expense (benefit) Net income (loss) including noncontrolling interests Net income (loss) attributable to noncontrolling interests Net income (loss) attributable to ExxonMobil 155,16436,0359,5740 94,007 20,607 30,431 1,054 10,168 786 46,009 947 1,285 1,205 30,239 1,158 254,406 26,122 31,234 Earnings (Loss) per common share (dollars) Earnings (Loss) per common share - assuming dilution (dollars) 7,636 (28,883) 143,801 156,172 36,826 36,682 11,398 11,480 18,998 18,745 1,269 1,466 1,235 1,285 830 766 23,598 (5,632) 30,525 (23,251) 244,882259,259 558 (811) 20,056 30,953 9,532 21,421 \begin{tabular}{rr} 5,282 & 9,532 \\ \hline 14,774 & 21,421 \\ \hline 434 & \end{tabular} 23,040 (22,440) 434 581 14,340 20,840 (5.25) 3.36 4.88 (5.25) 3.36 4.88 SUMMARY BALANCE SHEET AT YEAR END (milions of dollars) 2021 Assets Current assets Cash and cash equivalents Notes and accounts receivable - net Inventories Crude oil, products and merchandise Materials and supplies Liabilities Current liabilities Notes and loans payable Accounts payable and accrued liabilities Income taxes payable 14,519 2020 2019 2018 Long-term debt Postretirement benefits reserves Deferred income tax liabilities Long-term obligations to equity companies Other long-term obligations Total liabilities \begin{tabular}{r} 4,261 \\ 1,189 \\ 59,154 \\ 45,195 \\ 216,552 \\ \hline 18,022 \\ 338,923 \end{tabular} 14,169 14,01014,803 Commitments and contingencies Equity Common stock without par value Earnings reinvested Accumulated other comprehensive income Common stock held in treasury ExcxonMobil share of equity Noncontrolling interests Total equity Total liabilities and equity 20,458 35,221 884 3,089 3,042 26,96824,701 SUMMARY STATEMENT OF CASH FLOWS (millions of dollars) 2021 2020 2019 2018 Cash flows from operating activities Net income (loss) including noncontrolling interests Adjustments for noncash transactions Depreciation and depletion (includes impairments) Deferred income tax charges/(credits) Postretirement benefits expense in excess of/(less than) net payments Other long-term obligation provisions in excess of/(less than) payments Dividends received greater than/(less than) equity in current earnings of equity companies Changes in operational working capital, excluding cash and debt Reduction/(increase) - Notes and accounts receivable 23,598 (23,251) 14,774 21,421 - Inventories - Other current assets Increase/(reduction) - Accounts and other payables Net (gain)loss on asset sales All other items - net 20,607 46,009 18,998 18,745 303 (8,856) (60) 109 498 (1,289) (3,038) (68) 979 (936) (1,684) Net cash provided by operating activities [12,098) 5,384 (545) (489) (315) (2,640) (3,107) (25) 234) (7,142) 3,725 2,321 Cash flows from investing activities Additions to property. plant and equipment Proceeds from gsset sales and returns of investments Additional investments and advances Other investing activities including collection of advances Net cash used in investing activities [1,207) (1,710)(1,993) 530 4 48,129 2,207 1,540 (61) Cash flows from financing activities Additions to long-term debt Reductions in long-term debt Additions to short-term debt 1 Reductions in short-term debt 1 Additions/(reductions) in commercial paper, and debt with three months or less maturity Contingent consideration payments (12,076) (17,282) (24,361) (19,574) 3,176 999 3,692 4,123 (2,817)(4,857)(3,905)(1,981) Cash dividends to ExxonMobil shareholders [10,235} 2,681 (23,084)(16,446) Cash dividends to noncontrolling interests Changes in noncontrolling interests Common stook acquired 46 23,186 7,052 (8) (8) (1) 35,398 18,987 Net cash provided by (used in) financing activities (28,742) (18,367) (4,752) Effects of exchange rate changes on cash Increase/(decrease) in cash and cash equivalents Cash and cash equivalents at beginning of year Cash and cash equivalents at end of year (29,396) (9,691) 1,011 (219) (21) (14,865) (14,652) (13,798) (188) (192) (243) 623 158 146 (405) (594) (626) (35,423) 5,285 (6,618) (19,446) (219) \begin{tabular}{cc} 33 & (257) \\ \hline 47 & (135) \\ \hline 3,042 & 3,177 \\ \hline 3,089 & 3,042 \\ \hline \end{tabular} cash and cash equivaients at end or year ar SUMMARY STATEMENT OF INCOME (millions of dollars) 2021 2020 2019 2018 Revenues and other income Costs and other deductions Crude oil and product purchases Production and manufacturing expenses Selling, general and administrative expenses Depreciation and depletion (includes impairments) Exploration expenses, including dry holes Non-service pension and postretirement benefit expense Interest expense Other taxes and duties Total costs and other deductions Income (Loss) before income taxes Income tax expense (benefit) Net income (loss) including noncontrolling interests Net income (loss) attributable to noncontrolling interests Net income (loss) attributable to ExxonMobil 155,16436,0359,5740 94,007 20,607 30,431 1,054 10,168 786 46,009 947 1,285 1,205 30,239 1,158 254,406 26,122 31,234 Earnings (Loss) per common share (dollars) Earnings (Loss) per common share - assuming dilution (dollars) 7,636 (28,883) 143,801 156,172 36,826 36,682 11,398 11,480 18,998 18,745 1,269 1,466 1,235 1,285 830 766 23,598 (5,632) 30,525 (23,251) 244,882259,259 558 (811) 20,056 30,953 9,532 21,421 \begin{tabular}{rr} 5,282 & 9,532 \\ \hline 14,774 & 21,421 \\ \hline 434 & \end{tabular} 23,040 (22,440) 434 581 14,340 20,840 (5.25) 3.36 4.88 (5.25) 3.36 4.88 SUMMARY BALANCE SHEET AT YEAR END (milions of dollars) 2021 Assets Current assets Cash and cash equivalents Notes and accounts receivable - net Inventories Crude oil, products and merchandise Materials and supplies Liabilities Current liabilities Notes and loans payable Accounts payable and accrued liabilities Income taxes payable 14,519 2020 2019 2018 Long-term debt Postretirement benefits reserves Deferred income tax liabilities Long-term obligations to equity companies Other long-term obligations Total liabilities \begin{tabular}{r} 4,261 \\ 1,189 \\ 59,154 \\ 45,195 \\ 216,552 \\ \hline 18,022 \\ 338,923 \end{tabular} 14,169 14,01014,803 Commitments and contingencies Equity Common stock without par value Earnings reinvested Accumulated other comprehensive income Common stock held in treasury ExcxonMobil share of equity Noncontrolling interests Total equity Total liabilities and equity 20,458 35,221 884 3,089 3,042 26,96824,701
 Step by Step Solution
There are 3 Steps involved in it
Step: 1

Get Instant Access to Expert-Tailored Solutions
See step-by-step solutions with expert insights and AI powered tools for academic success
Step: 2

Step: 3
Ace Your Homework with AI
Get the answers you need in no time with our AI-driven, step-by-step assistance
Get Started
How To Trade In Stocks
Authors: Jesse Livermore
1st Edition
0071469796, 9780071469791