Question
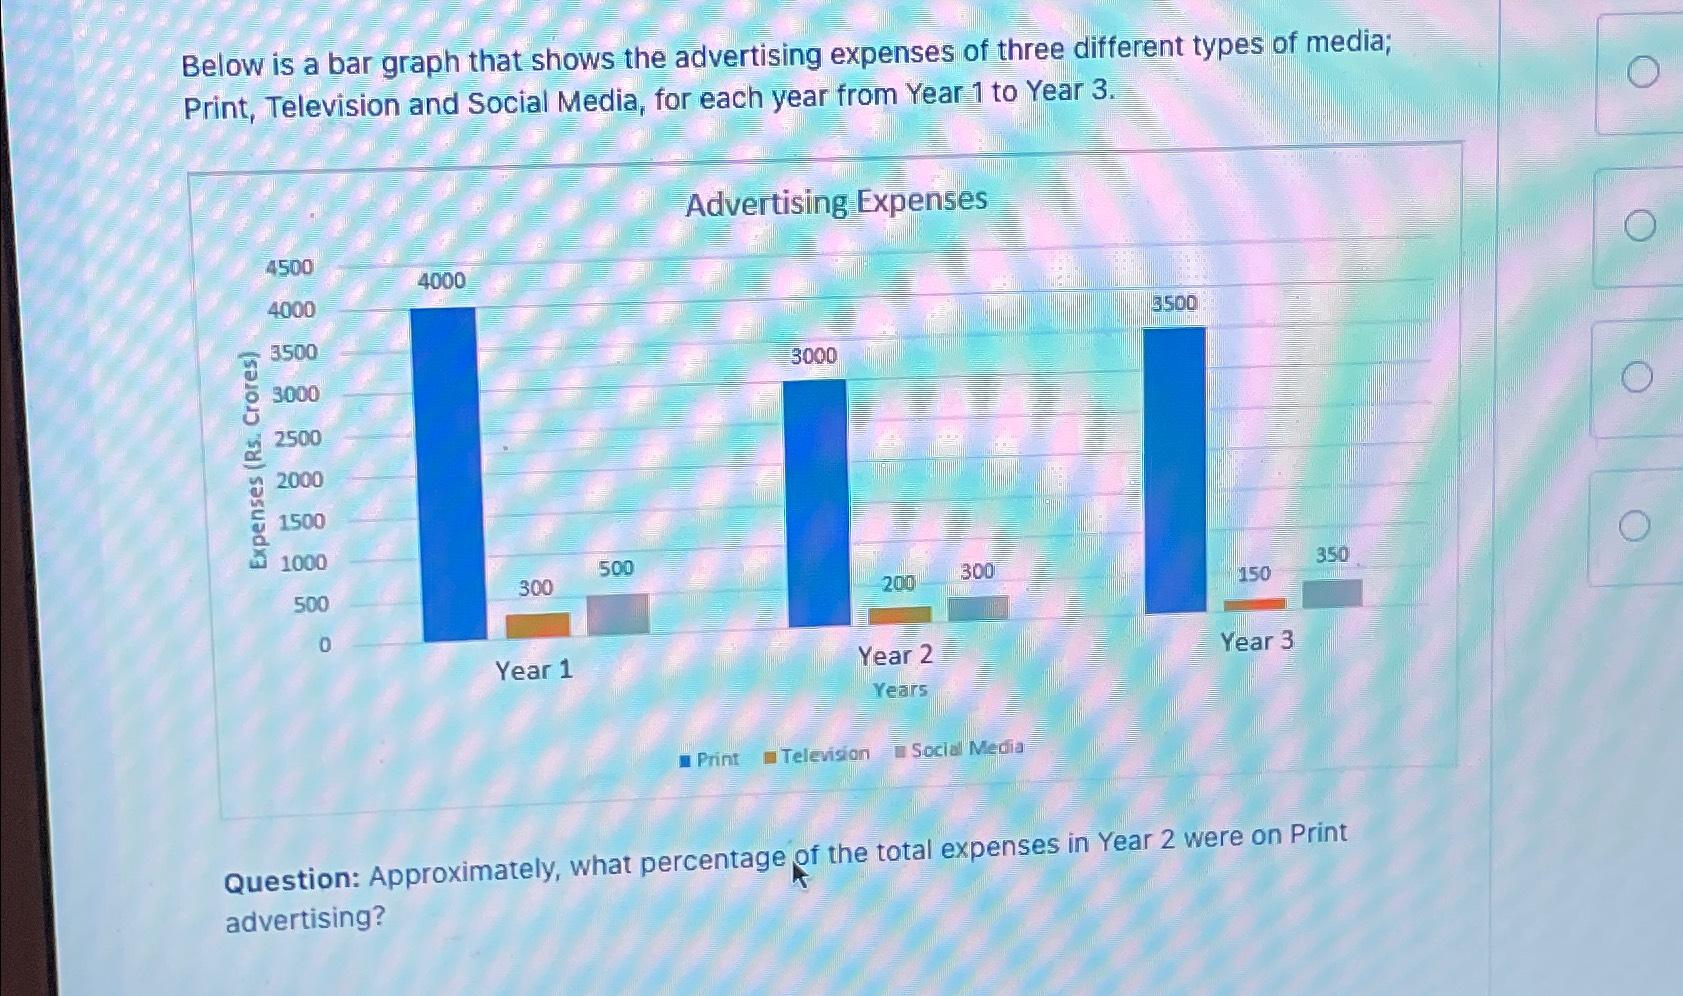
Below is a bar graph that shows the advertising expenses of three different types of media; Print, Television and Social Media, for each year

Below is a bar graph that shows the advertising expenses of three different types of media; Print, Television and Social Media, for each year from Year 1 to Year 3. Expenses (Rs. Crores) 4500 4000 3500 3000 2500 2000 1500 1000 500 0 4000 300 Year 1 500 Advertising Expenses 3000 200 Year 2 Years 300 Print Television Social Media 3500 150 Year 3 350 Question: Approximately, what percentage of the total expenses in Year 2 were on Print advertising?
Step by Step Solution
There are 3 Steps involved in it
Step: 1
Answer is 35 Explanation To find the percentage of tota...
Get Instant Access to Expert-Tailored Solutions
See step-by-step solutions with expert insights and AI powered tools for academic success
Step: 2

Step: 3

Ace Your Homework with AI
Get the answers you need in no time with our AI-driven, step-by-step assistance
Get StartedRecommended Textbook for
Principles of Information Systems
Authors: Ralph Stair, George Reynolds
11th edition
1133629660, 978-1133629665
Students also viewed these General Management questions
Question
Answered: 1 week ago
Question
Answered: 1 week ago
Question
Answered: 1 week ago
Question
Answered: 1 week ago
Question
Answered: 1 week ago
Question
Answered: 1 week ago
Question
Answered: 1 week ago
Question
Answered: 1 week ago
Question
Answered: 1 week ago
Question
Answered: 1 week ago
Question
Answered: 1 week ago
Question
Answered: 1 week ago
Question
Answered: 1 week ago
Question
Answered: 1 week ago
Question
Answered: 1 week ago
Question
Answered: 1 week ago
Question
Answered: 1 week ago
Question
Answered: 1 week ago
Question
Answered: 1 week ago
View Answer in SolutionInn App


