

Answered step by step
Verified Expert Solution
Question
1 Approved Answer
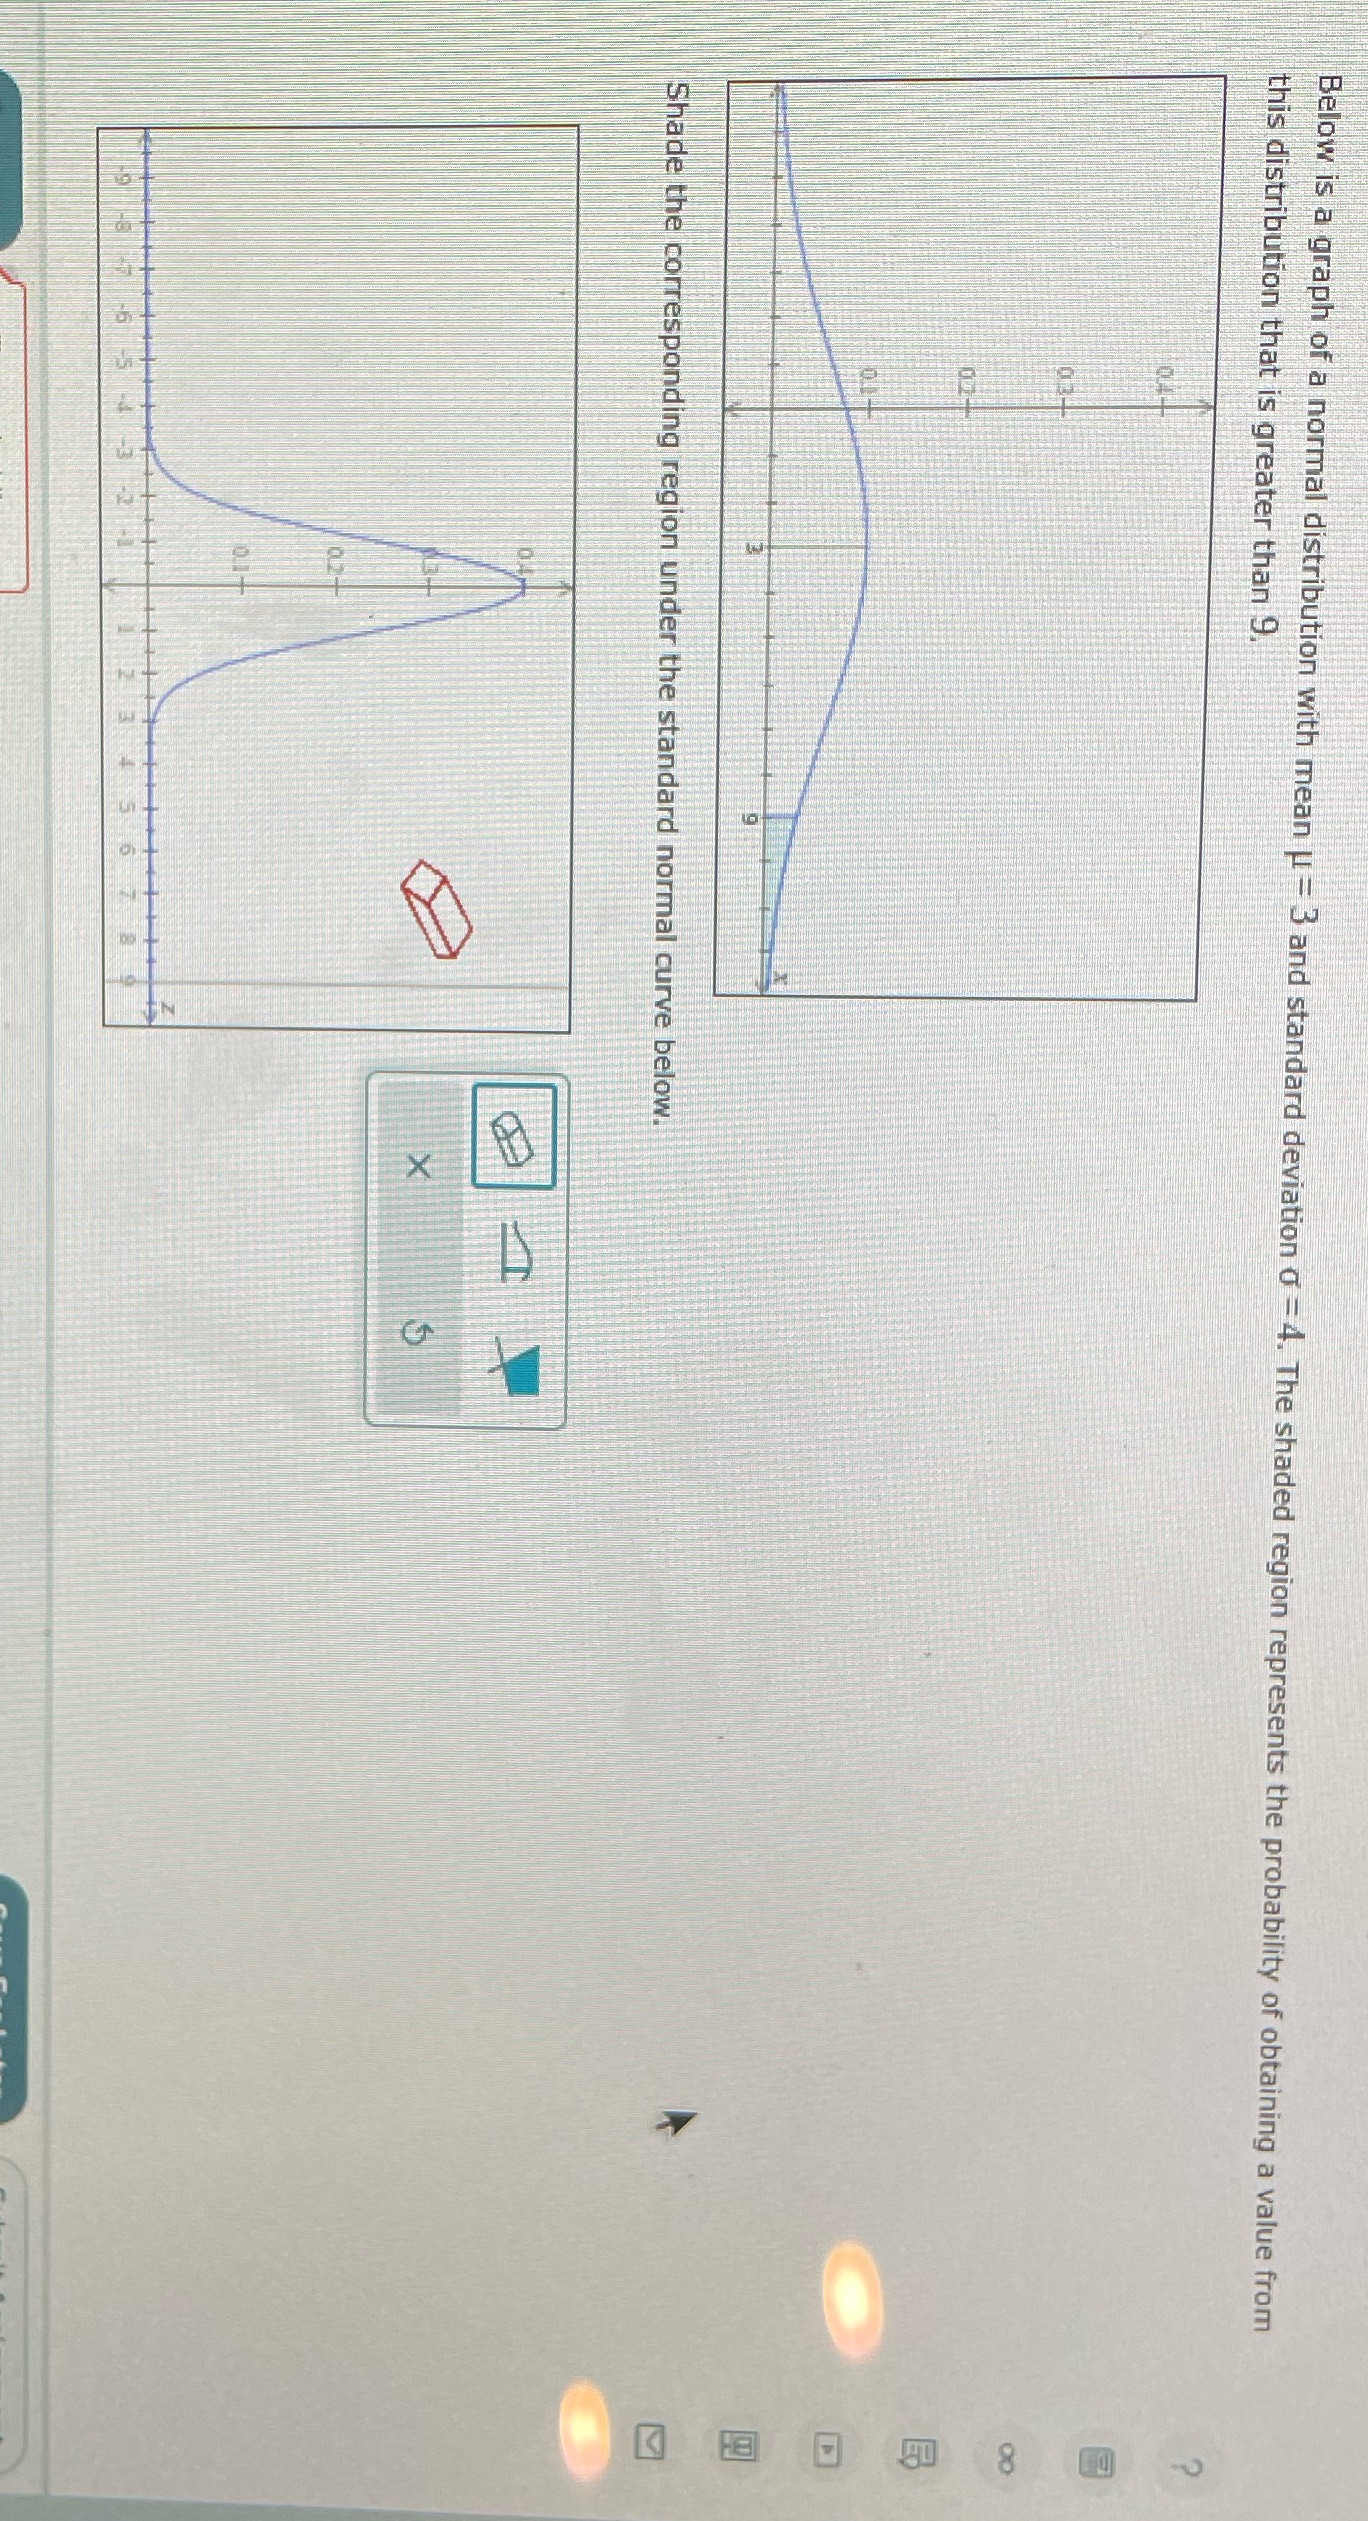
Below is a graph of a normal distribution with mean U = 3 and standard deviation O = 4. The shaded region represents the probability

Step by Step Solution
There are 3 Steps involved in it
Step: 1

Get Instant Access to Expert-Tailored Solutions
See step-by-step solutions with expert insights and AI powered tools for academic success
Step: 2

Step: 3
Ace Your Homework with AI
Get the answers you need in no time with our AI-driven, step-by-step assistance
Get Started
Numerical Analysis And Optimization NAO-III, Muscat, Oman, January 2014
Authors: Mehiddin Al Baali, Lucio Grandinetti, Anton Purnama
1st Edition
3319176897, 9783319176895