

Answered step by step
Verified Expert Solution
Question
1 Approved Answer
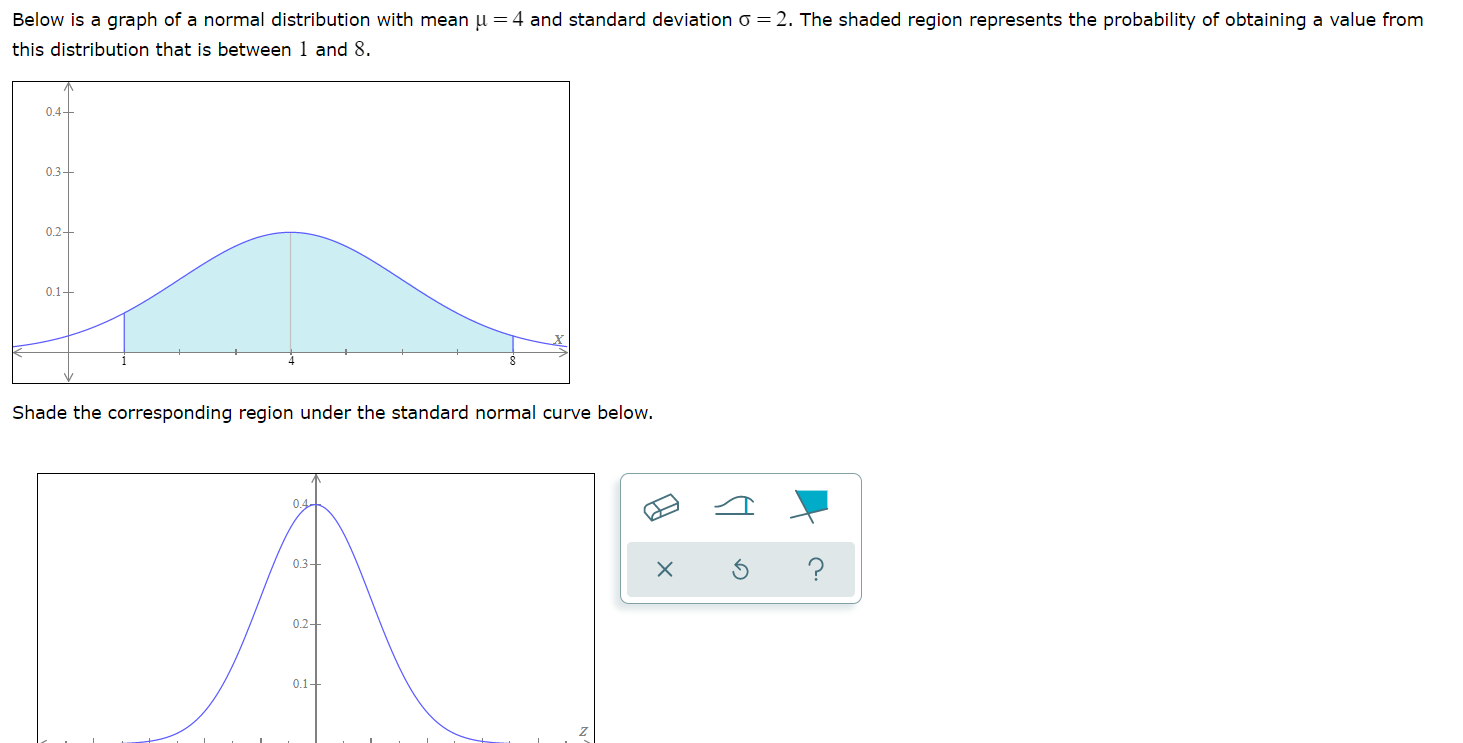
Below is a graph of a normal distribution with mean u =4 and standard deviation o = 2. The shaded region represents the probability of

Step by Step Solution
There are 3 Steps involved in it
Step: 1

Get Instant Access to Expert-Tailored Solutions
See step-by-step solutions with expert insights and AI powered tools for academic success
Step: 2

Step: 3
Ace Your Homework with AI
Get the answers you need in no time with our AI-driven, step-by-step assistance
Get Started
Intermediate Algebra Functions & Authentic Applications
Authors: Jay Lehmann
5th Edition
0321923464, 9780321923462