Question
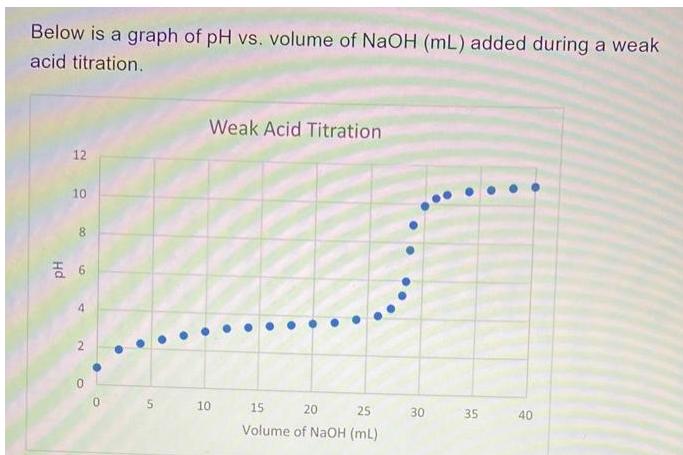
Below is a graph of pH vs. volume of NaOH (mL) added during a weak acid titration. 12 10 00 6 4 N 2


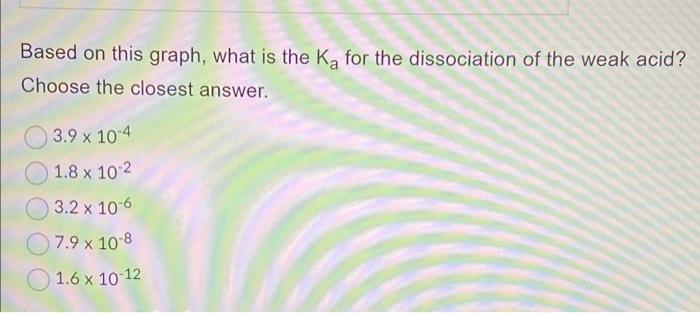
Below is a graph of pH vs. volume of NaOH (mL) added during a weak acid titration. 12 10 00 6 4 N 2 5 Weak Acid Titration 10 15 20 25 Volume of NaOH (mL) 30 35 40 Based on this graph, what is the K for the dissociation of the weak acid? Choose the closest answer. 3.9 x 10⁻⁴ 1.8 x 10⁻² 3.2 x 10⁻⁶ 7.9 x 10⁻⁸ 1.6 x 10⁻¹²
Step by Step Solution
There are 3 Steps involved in it
Step: 1
The detailed answer for the above question is prov...
Get Instant Access to Expert-Tailored Solutions
See step-by-step solutions with expert insights and AI powered tools for academic success
Step: 2

Step: 3

Ace Your Homework with AI
Get the answers you need in no time with our AI-driven, step-by-step assistance
Get StartedRecommended Textbook for
Linear Algebra A Modern Introduction
Authors: David Poole
3rd edition
9781133169574 , 978-0538735452
Students also viewed these Chemistry questions
Question
Answered: 1 week ago
Question
Answered: 1 week ago
Question
Answered: 1 week ago
Question
Answered: 1 week ago
Question
Answered: 1 week ago
Question
Answered: 1 week ago
Question
Answered: 1 week ago
Question
Answered: 1 week ago
Question
Answered: 1 week ago
Question
Answered: 1 week ago
Question
Answered: 1 week ago
Question
Answered: 1 week ago
Question
Answered: 1 week ago
Question
Answered: 1 week ago
Question
Answered: 1 week ago
Question
Answered: 1 week ago
Question
Answered: 1 week ago
Question
Answered: 1 week ago
Question
Answered: 1 week ago
Question
Answered: 1 week ago
Question
Answered: 1 week ago
Question
Answered: 1 week ago
View Answer in SolutionInn App


