Answered step by step
Verified Expert Solution
Link Copied!

Question

1 Approved Answer

Below is a graph of the annual yield, y(t), in bushels per year, from an orchard t years after planting, 400 300 200 100 t
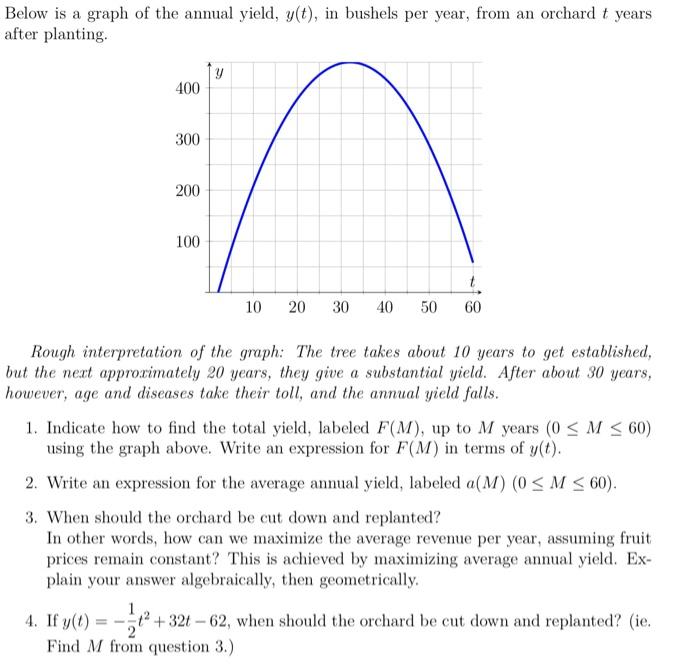
image text in transcribed
Below is a graph of the annual yield, y(t), in bushels per year, from an orchard t years after planting, 400 300 200 100 t 60 10 20 30 40 50 Rough interpretation of the graph: The tree takes about 10 years to get established, but the next approximately 20 years, they give a substantial yield. After about 30 years, however, age and diseases take their toll, and the annual yield falls. 1. Indicate how to find the total yield, labeled F(M), up to M years (0

Step by Step Solution

There are 3 Steps involved in it

Step: 1

blur-text-image

Get Instant Access to Expert-Tailored Solutions

See step-by-step solutions with expert insights and AI powered tools for academic success

Step: 2

blur-text-image

Step: 3

blur-text-image

Ace Your Homework with AI

Get the answers you need in no time with our AI-driven, step-by-step assistance

Get Started

Recommended Textbook for

How To Make Money With Junk Bonds

Authors: Robert Levine

1st Edition

007179381X,0071793828

More Books

Students also viewed these Finance questions

Question

Managerial economics is applied microeconomics. Elucidate.

Answered: 1 week ago