

Question
Below is a histogram of NFL salaries of the 2000 players from 2017. The horizontal scale is in millions. The mean is 1.49 million with
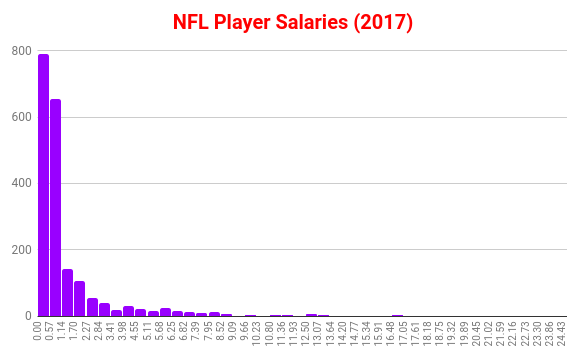
Below is a histogram of NFL salaries of the 2000 players from 2017. The horizontal scale is in millions. The mean is 1.49 million with a standard deviation of 2.25 million. If we took a random sample of 100 players and computed their mean salary and then repeated this 1000 times and then made a histogram of those values, explain what the shape of the histogram would look like and why.
Step by Step Solution
There are 3 Steps involved in it
Step: 1

Get Instant Access to Expert-Tailored Solutions
See step-by-step solutions with expert insights and AI powered tools for academic success
Step: 2

Step: 3
Ace Your Homework with AI
Get the answers you need in no time with our AI-driven, step-by-step assistance
Get Started
Geometry And Analysis Of Fractals Hong Kong, December 2012
Authors: De Jun Feng, Ka Sing Lau
1st Edition
3662439204, 9783662439203