Answered step by step
Verified Expert Solution
Question
1 Approved Answer
Below is a list of ages (in years) and annual salaries (in thousands of dollars). Age= | Salary | g1 35 2 23 T o3
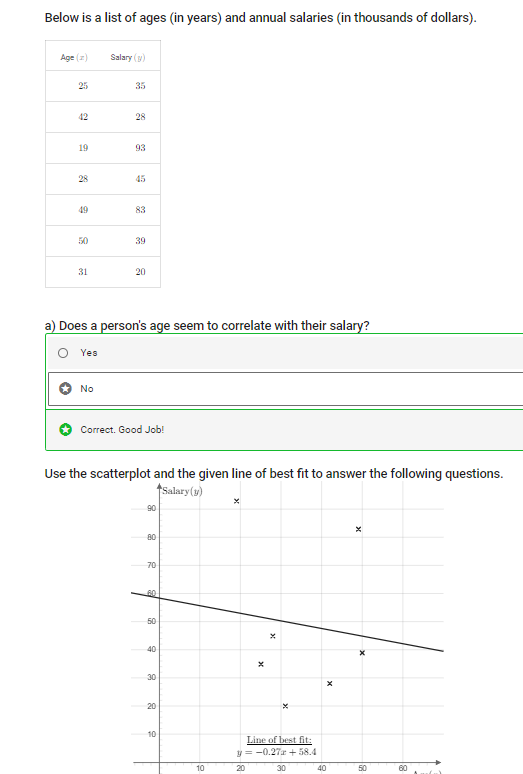
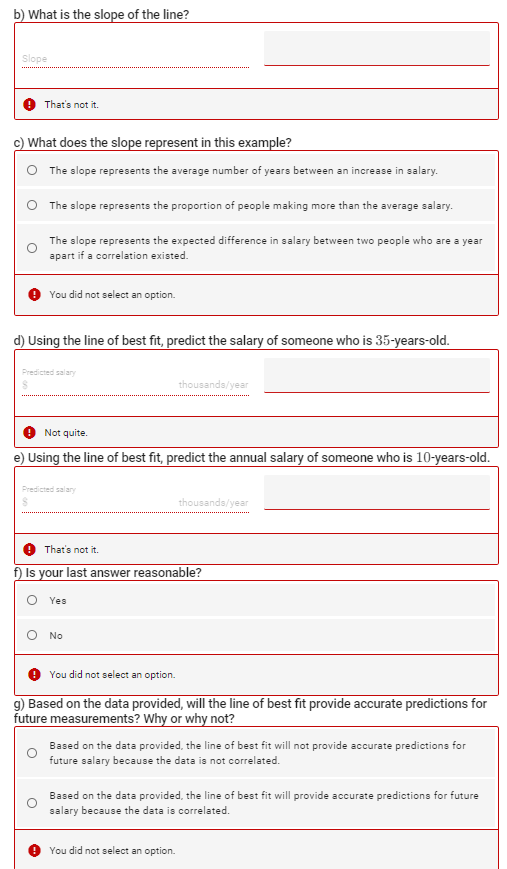
Below is a list of ages (in years) and annual salaries (in thousands of dollars). Age= | Salary | g1 35 2 23 T o3 28 i a3 a0 ad 3 20 a) Does a person's age seem to correlate with their salary? i1 Yes Limse of best fit: = 0.27r + 58.4 b) What is the slope of the line? Slope That's not it. c) What does the slope represent in this example? The slope represents the average number of years between an increase in salary. The slope represents the proportion of people making more than the average salary. O The slope represents the expected difference in salary between two people who are a year apart if a correlation existed. You did not select an option. d) Using the line of best fit, predict the salary of someone who is 35-years-old. Predicted salary thousands/year Not quite. e) Using the line of best fit, predict the annual salary of someone who is 10-years-old. Predicted salary thousands/year That's not it. f) Is your last answer reasonable? Yes O No You did not select an option. g) Based on the data provided, will the line of best fit provide accurate predictions for future measurements? Why or why not? O Based on the data provided, the line of best fit will not provide accurate predictions for future salary because the data is not correlated. O Based on the data provided, the line of best fit will provide accurate predictions for future salary because the data is correlated. You did not select an option
Step by Step Solution
There are 3 Steps involved in it
Step: 1
Get Instant Access to Expert-Tailored Solutions
See step-by-step solutions with expert insights and AI powered tools for academic success
Step: 2
Step: 3
Ace Your Homework with AI
Get the answers you need in no time with our AI-driven, step-by-step assistance
Get Started