Answered step by step
Verified Expert Solution
Link Copied!

Question

1 Approved Answer

Below is a network diagram: Below is a network diagram, with times shown in days. Use Table B1 and Table B2. Click here for the

Below is a network diagram:
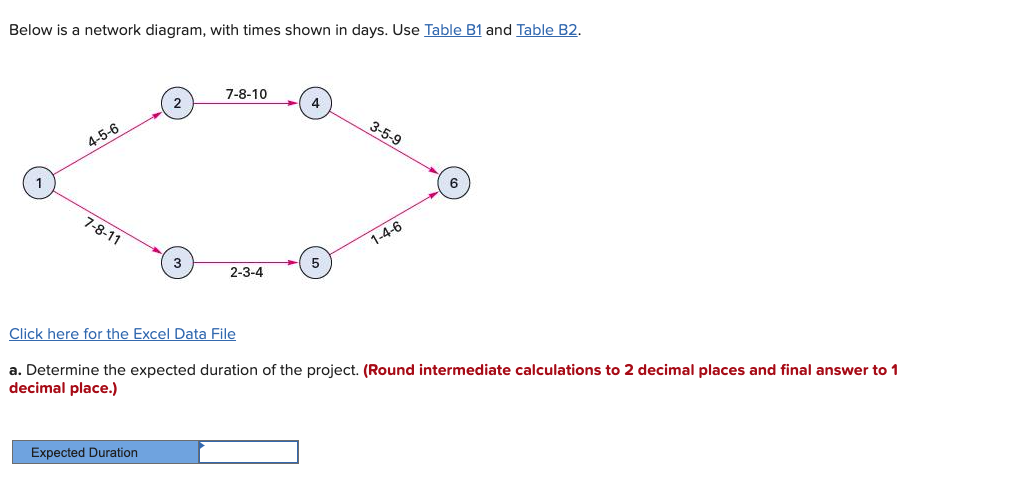
image text in transcribed

image text in transcribed

Below is a network diagram, with times shown in days. Use Table B1 and Table B2. Click here for the Excel Data File a. Determine the expected duration of the project. (Round intermediate calculations to 2 decimal places and final answer to 1 decimal place.) Compute the probability that the project will take at least 18 days. (Round intermediate calculations to 2 decimal places and Probability" values to 4 decimal places.)

Step by Step Solution

There are 3 Steps involved in it

Step: 1

blur-text-image

Get Instant Access to Expert-Tailored Solutions

See step-by-step solutions with expert insights and AI powered tools for academic success

Step: 2

blur-text-image

Step: 3

blur-text-image

Ace Your Homework with AI

Get the answers you need in no time with our AI-driven, step-by-step assistance

Get Started

Recommended Textbook for

Scheduling In Industry 4.0 And Cloud Manufacturing

Authors: Boris Sokolov, Dmitry Ivanov, Alexandre Dolgui

1st Edition

3030431762, 9783030431761

More Books

Students also viewed these General Management questions