

Answered step by step
Verified Expert Solution
Question
1 Approved Answer
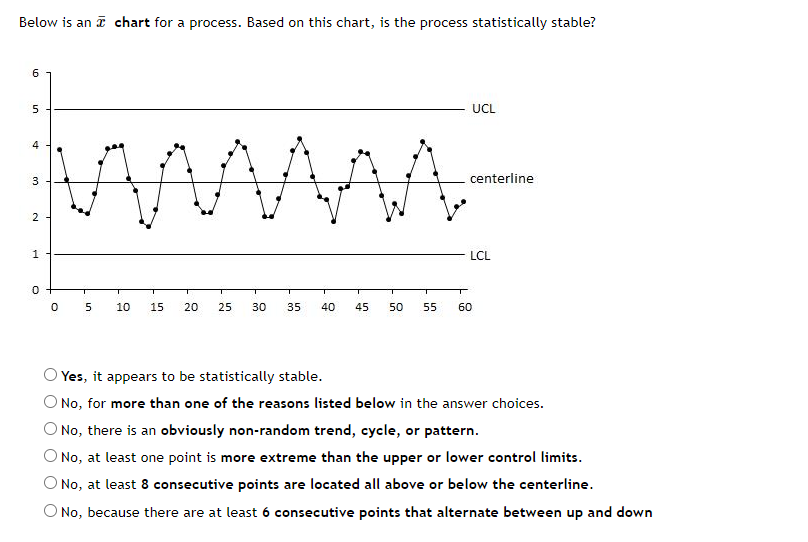
Below is an E chart for a process. Based on this chart. is the process statistically stable? 5 UCL 3 centerline 1 LCL '1:3'Yes, it
Step by Step Solution
There are 3 Steps involved in it
Step: 1

Get Instant Access to Expert-Tailored Solutions
See step-by-step solutions with expert insights and AI powered tools for academic success
Step: 2

Step: 3
Ace Your Homework with AI
Get the answers you need in no time with our AI-driven, step-by-step assistance
Get Started
Calculus (Single Variable)
Authors: Michael Sullivan
1st Edition
1464142912, 9781464142918