Answered step by step
Verified Expert Solution
Question
1 Approved Answer
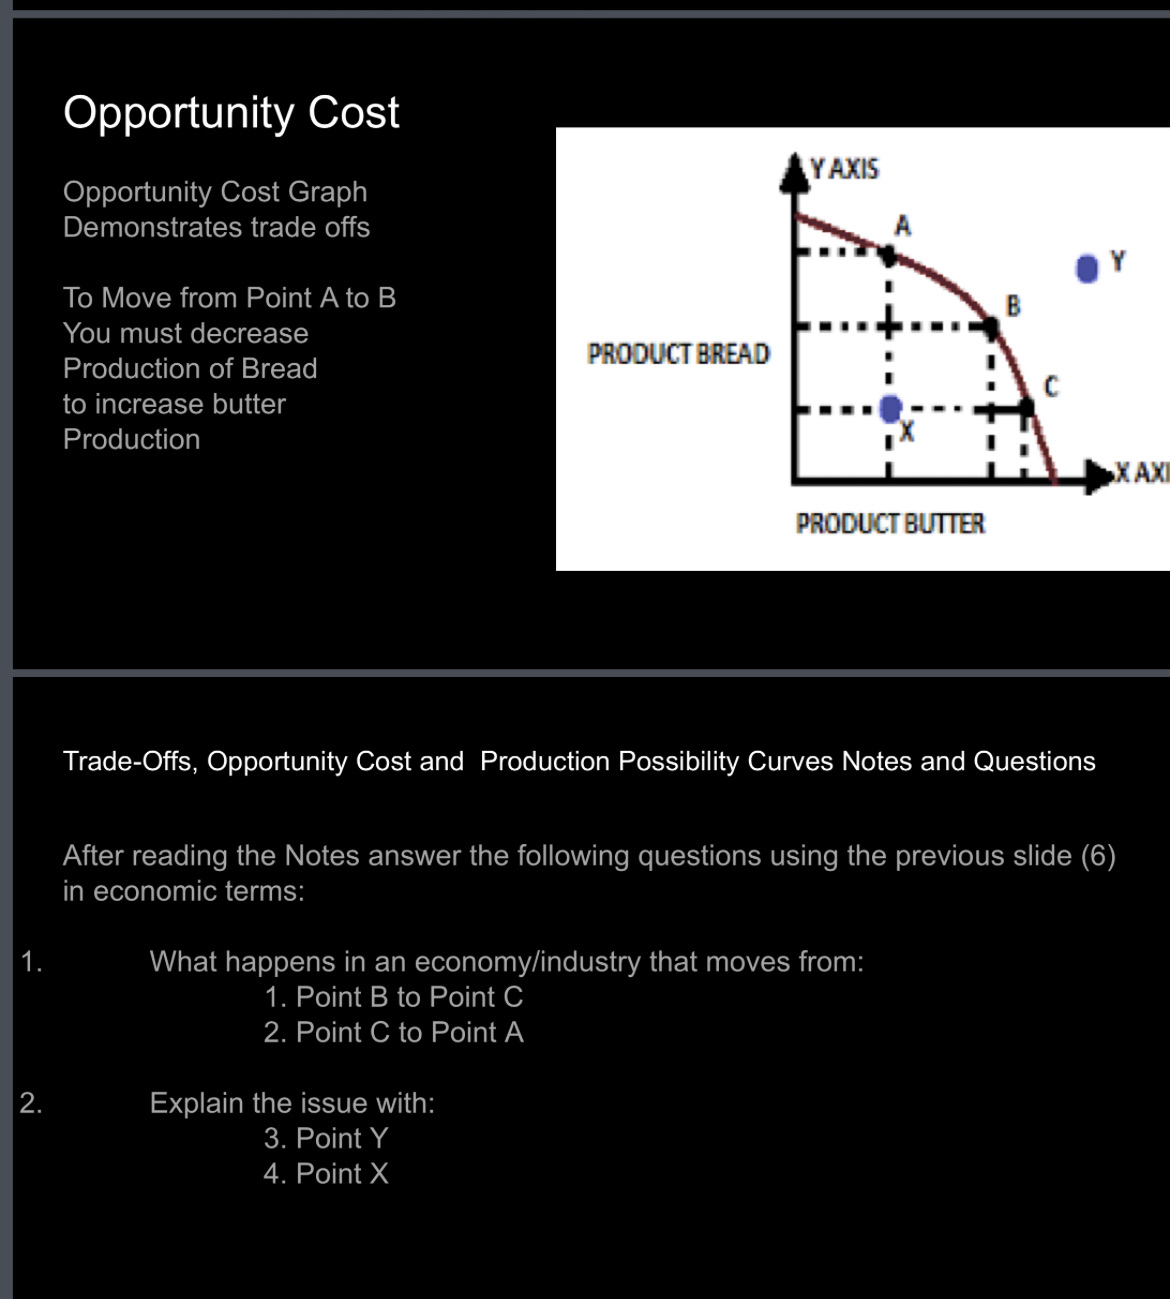
Below is an image relating to trade-offs, opportunity cost, and production possibility curve. Answer the following questions provided in the second slide. ? 1. 2.
Below is an image relating to trade-offs, opportunity cost, and production possibility curve. Answer the following questions provided in the second slide. ?

1. 2. Opportunity Cost Opportunity Cost Graph Demonstrates trade offs To Move from Point A to B You must decrease Production of Bread to increase butter Production PRODUCT BREAD Y AXIS PRODUCT BUTTER Trade-Offs, Opportunity Cost and Production Possibility Curves Notes and Questions Explain the issue with: 3. Point Y 4. Point X After reading the Notes answer the following questions using the previous slide (6) in economic terms: What happens in an economy/industry that moves from: 1. Point B to Point C 2. Point C to Point A X AXI
Step by Step Solution
There are 3 Steps involved in it
Step: 1
Movement between points Point C to Point A Moving from C to A represents increasing bread ...
Get Instant Access to Expert-Tailored Solutions
See step-by-step solutions with expert insights and AI powered tools for academic success
Step: 2

Step: 3

Ace Your Homework with AI
Get the answers you need in no time with our AI-driven, step-by-step assistance
Get Started


