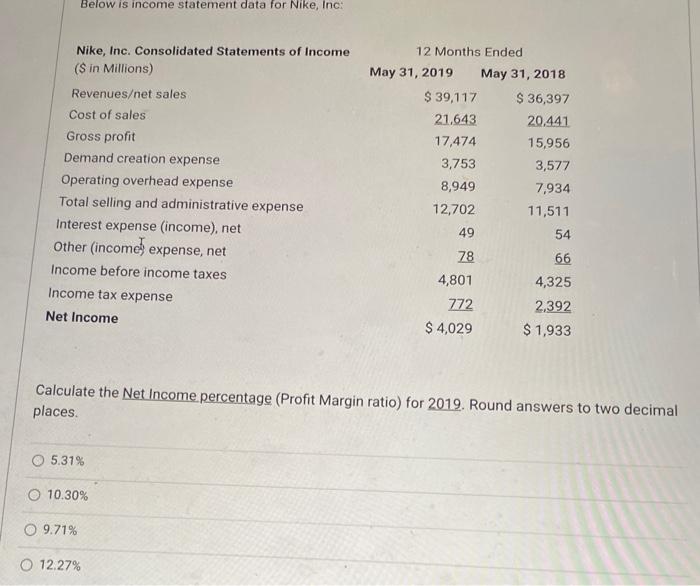
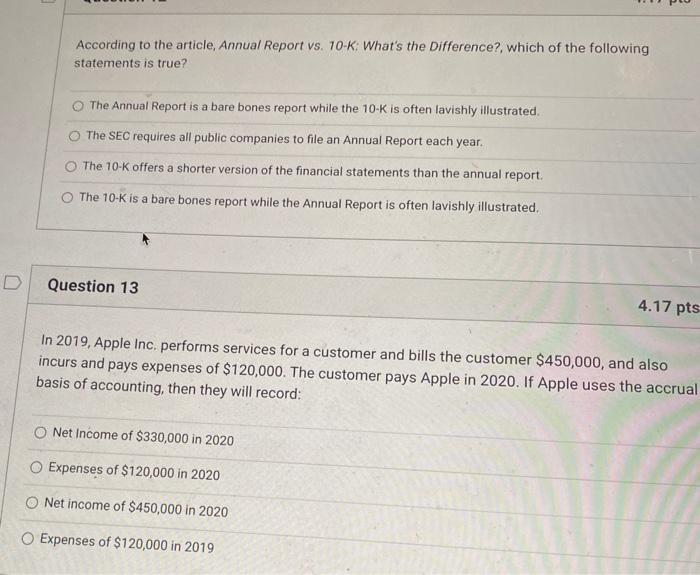
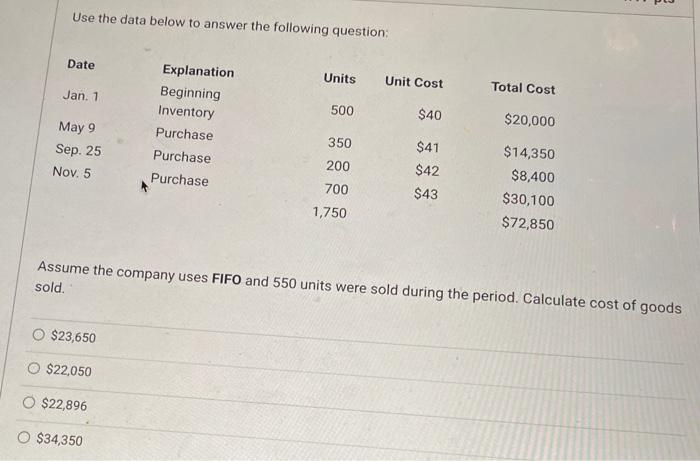
Below is income statement data for Nike, Inc: Nike, Inc. Consolidated Statements of Income (S in Millions) Revenueset sales Cost of sales Gross profit Demand creation expense Operating overhead expense Total selling and administrative expense Interest expense (income), net Other (income, expense, net Income before income taxes Income tax expense Net Income 12 Months Ended May 31, 2019 May 31, 2018 $ 39,117 $ 36,397 21.643 20.441 17,474 15,956 3,753 3,577 8,949 7,934 12,702 11,511 49 54 78 66 4,801 4,325 772 2,392 $ 4,029 $ 1,933 Calculate the Net Income percentage (Profit Margin ratio) for 2019. Round answers to two decimal places. 5.31% O 10.30% O 9.71% O 12.27% According to the article, Annual Report vs. 10-K: What's the Difference?, which of the following statements is true? The Annual Report is a bare bones report while the 10-K is often lavishly illustrated The SEC requires all public companies to file an Annual Report each year. The 10-K offers a shorter version of the financial statements than the annual report. The 10-K is a bare bones report while the Annual Report is often lavishly illustrated, D Question 13 4.17 pts In 2019, Apple Inc, performs services for a customer and bills the customer $450,000, and also incurs and pays expenses of $120,000. The customer pays Apple in 2020. If Apple uses the accrual basis of accounting, then they will record: Net Income of $330,000 in 2020 Expenses of $120,000 in 2020 Net income of $450,000 in 2020 Expenses of $120,000 in 2019 Use the data below to answer the following question: Date Units Unit Cost Total Cost Jan. 1 500 $40 Explanation Beginning Inventory Purchase Purchase Purchase $20,000 May 9 Sep. 25 Nov. 5 350 200 700 1,750 $41 $42 $43 $14,350 $8,400 $30,100 $72,850 Assume the company uses FIFO and 550 units were sold during the period. Calculate cost of goods sold. $23,650 $22,050 $22,896 O $34,350