Answered step by step
Verified Expert Solution
Question
1 Approved Answer
Below is some background information about vapor liquid equilibrium of mixtures - you can read if you'd like, but it's not required to do


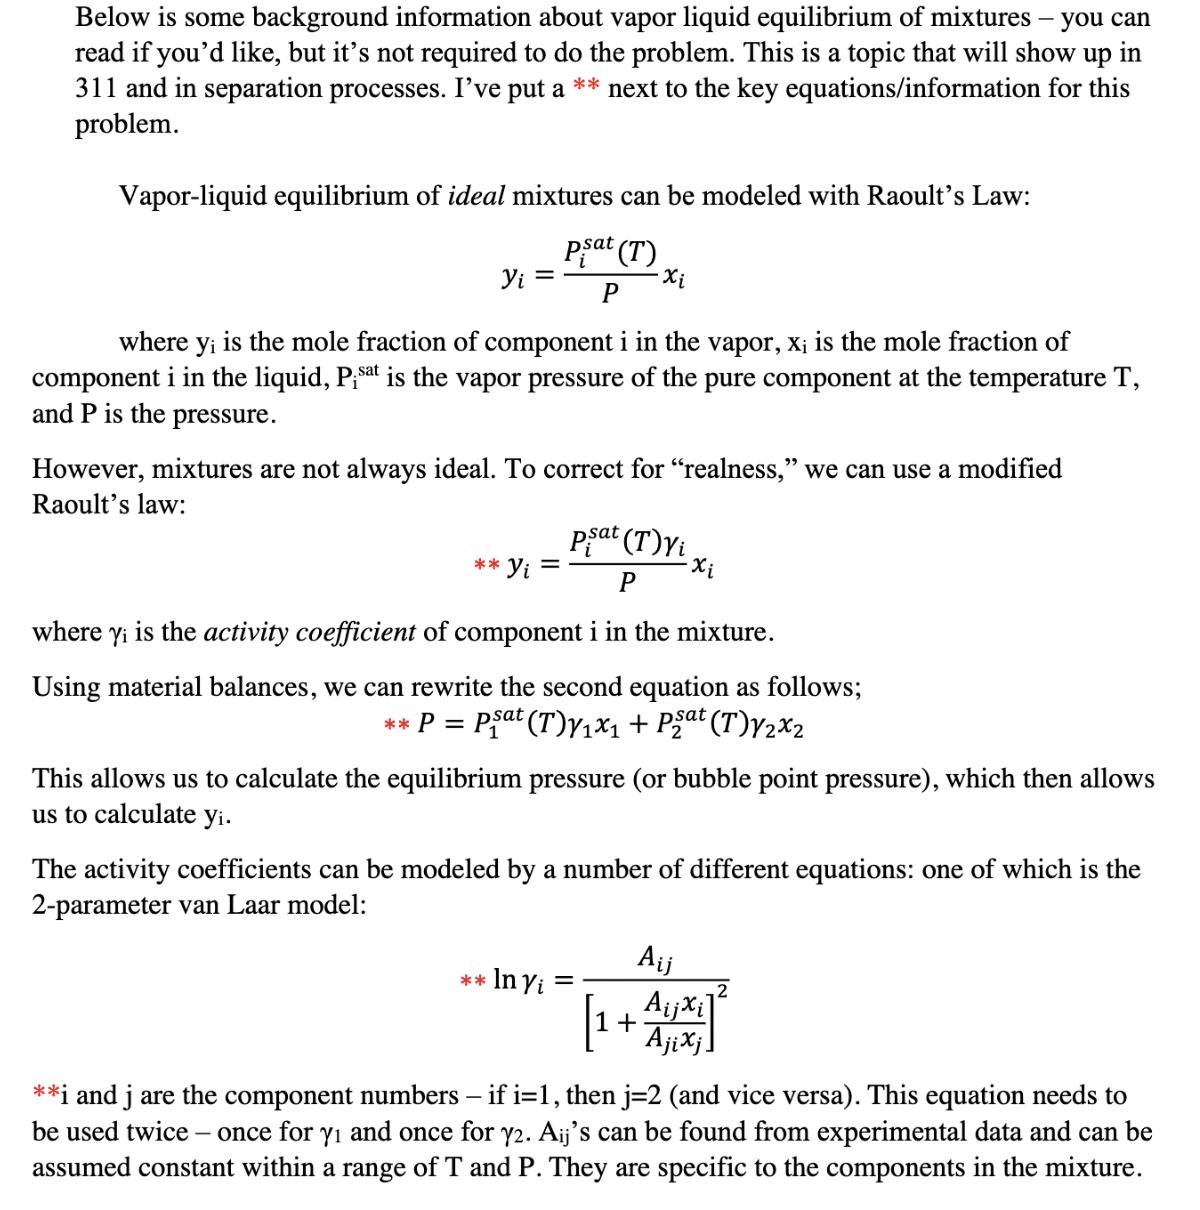
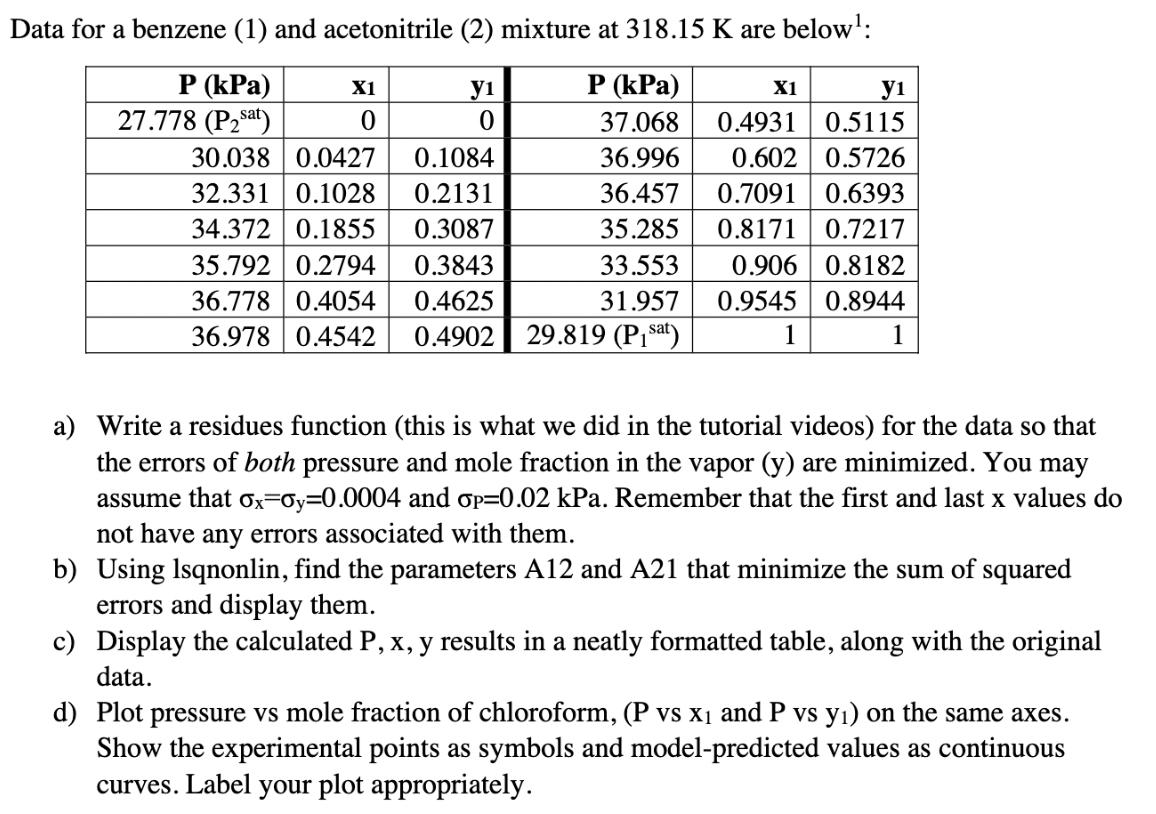
Below is some background information about vapor liquid equilibrium of mixtures - you can read if you'd like, but it's not required to do the problem. This is a topic that will show up in 311 and in separation processes. I've put a ** next to the key equations/information for this problem. Vapor-liquid equilibrium of ideal mixtures can be modeled with Raoult's Law: Psat (T) Yi = P where y; is the mole fraction of component i in the vapor, X is the mole fraction of component i in the liquid, Pisat is the vapor pressure of the pure component at the temperature T, and P is the pressure. However, mixtures are not always ideal. To correct for "realness," we can use a modified Raoult's law: Psat (T)Yi ** Yi = -xi P where Yi is the activity coefficient of component i in the mixture. Using material balances, we can rewrite the second equation as follows; ** P = Psat (T)Y1x1 + Pat (T)Y2x2 This allows us to calculate the equilibrium pressure (or bubble point pressure), which then allows us to calculate yi. The activity coefficients can be modeled by a number of different equations: one of which is the 2-parameter van Laar model: Aij ** In Yi = Aijxi] + Ajixj **i and j are the component numbers - if i=1, then j=2 (and vice versa). This equation needs to be used twice - once for y and once for y2. Aij's can be found from experimental data and can be assumed constant within a range of T and P. They are specific to the components in the mixture. Data for a benzene (1) and acetonitrile (2) mixture at 318.15 K are below: P (kPa) X1 y1 P (kPa) X1 y1 27.778 (Psat) 0 0 37.068 0.4931 0.5115 30.038 0.0427 0.1084 36.996 0.602 0.5726 32.331 0.1028 0.2131 34.372 0.1855 0.3087 35.792 0.2794 0.3843 36.457 0.7091 0.6393 35.285 0.8171 0.7217 36.778 0.4054 0.4625 36.978 0.4542 0.4902 33.553 31.957 29.819 (Pisa) 0.906 0.8182 0.9545 0.8944 1 1 1 a) Write a residues function (this is what we did in the tutorial videos) for the data so that the errors of both pressure and mole fraction in the vapor (y) are minimized. You may assume that ox-oy=0.0004 and p=0.02 kPa. Remember that the first and last x values do not have any errors associated with them. b) Using Isqnonlin, find the parameters A12 and A21 that minimize the sum of squared errors and display them. c) Display the calculated P, x, y results in a neatly formatted table, along with the original data. d) Plot pressure vs mole fraction of chloroform, (P vs X1 and P vs y) on the same axes. Show the experimental points as symbols and model-predicted values as continuous curves. Label your plot appropriately.
Step by Step Solution
There are 3 Steps involved in it
Step: 1

Get Instant Access to Expert-Tailored Solutions
See step-by-step solutions with expert insights and AI powered tools for academic success
Step: 2

Step: 3

Ace Your Homework with AI
Get the answers you need in no time with our AI-driven, step-by-step assistance
Get Started


