Question
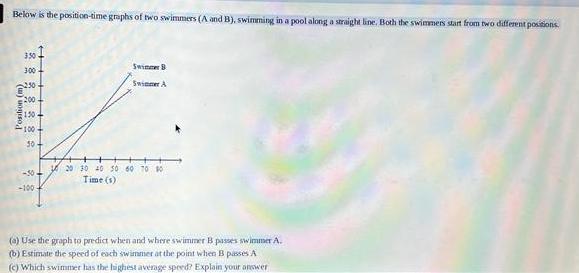
Below is the position-time graphs of two swimmers (A and B), swimming in a pool along a straight line. Both the swimmers start from

Below is the position-time graphs of two swimmers (A and B), swimming in a pool along a straight line. Both the swimmers start from two different positions 350 300 250- 200 150- 100+ 30+ Swimmer B Swimmer A -30- -100 20 30 40 50 60 70 80 Time(s) (a) Use the graph to predict when and where swimmer B passes swimmer A. (b) Estimate the speed of each swimmer at the point when B passes A (c) Which swimmer has the highest average speed? Explain your answer
Step by Step Solution
There are 3 Steps involved in it
Step: 1

Get Instant Access to Expert-Tailored Solutions
See step-by-step solutions with expert insights and AI powered tools for academic success
Step: 2

Step: 3

Ace Your Homework with AI
Get the answers you need in no time with our AI-driven, step-by-step assistance
Get StartedRecommended Textbook for
University Physics with Modern Physics
Authors: Hugh D. Young, Roger A. Freedman
14th edition
133969290, 321973615, 9780321973610, 978-0133977981
Students also viewed these Physics questions
Question
Answered: 1 week ago
Question
Answered: 1 week ago
Question
Answered: 1 week ago
Question
Answered: 1 week ago
Question
Answered: 1 week ago
Question
Answered: 1 week ago
Question
Answered: 1 week ago
Question
Answered: 1 week ago
Question
Answered: 1 week ago
Question
Answered: 1 week ago
Question
Answered: 1 week ago
Question
Answered: 1 week ago
Question
Answered: 1 week ago
Question
Answered: 1 week ago
Question
Answered: 1 week ago
Question
Answered: 1 week ago
Question
Answered: 1 week ago
Question
Answered: 1 week ago
Question
Answered: 1 week ago
Question
Answered: 1 week ago
Question
Answered: 1 week ago
View Answer in SolutionInn App


