

Answered step by step
Verified Expert Solution
Question
1 Approved Answer
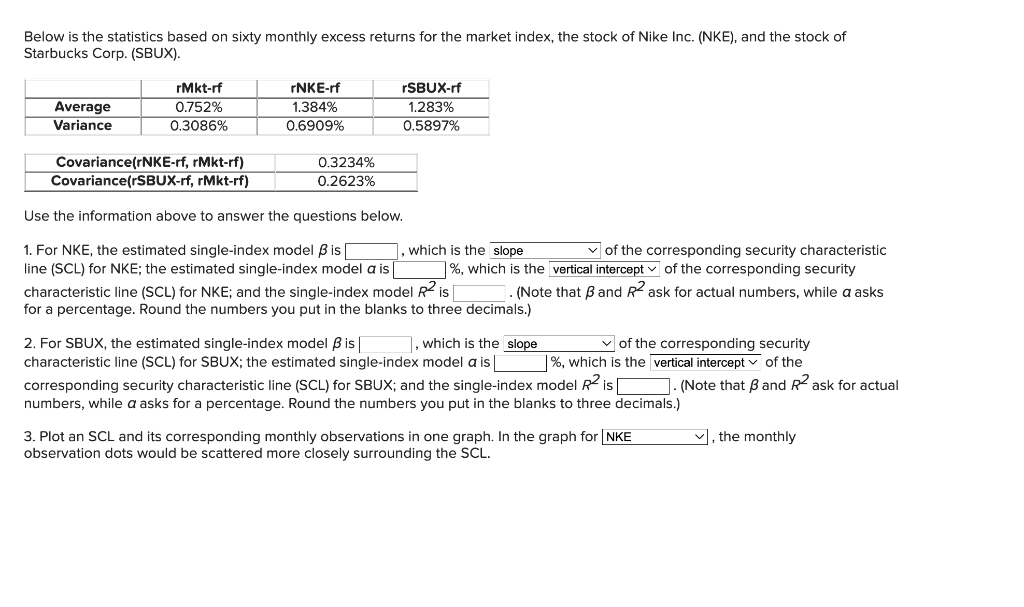
Below is the statistics based on sixty monthly excess returns for the market index, the stock of Nike Inc. (NKE), and the stock of Starbucks
Step by Step Solution
There are 3 Steps involved in it
Step: 1

Get Instant Access to Expert-Tailored Solutions
See step-by-step solutions with expert insights and AI powered tools for academic success
Step: 2

Step: 3
Ace Your Homework with AI
Get the answers you need in no time with our AI-driven, step-by-step assistance
Get Started
Forward Lease Sukuk In Islamic Capital Markets Structure And Governing Rules
Authors: Ahcene Lahsasna , M. Kabir Hassan , Rubi Ahmad
1st Edition
3319942611,331994262X