Answered step by step
Verified Expert Solution
Question
1 Approved Answer
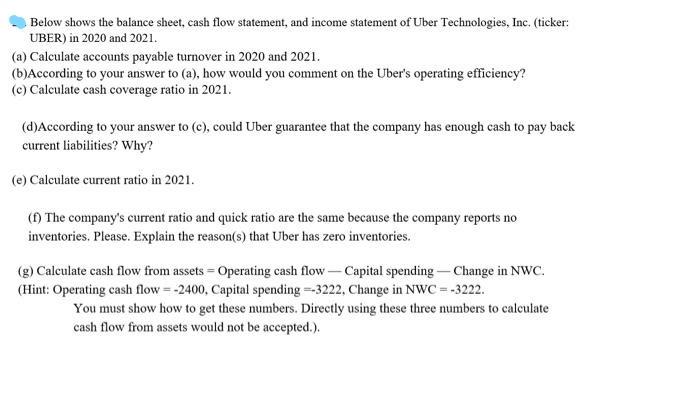
Below shows the balance sheet, cash flow statement, and income statement of Uber Technologies, Inc. (ticker: UBER) in 2020 and 2021. (a) Calculate accounts


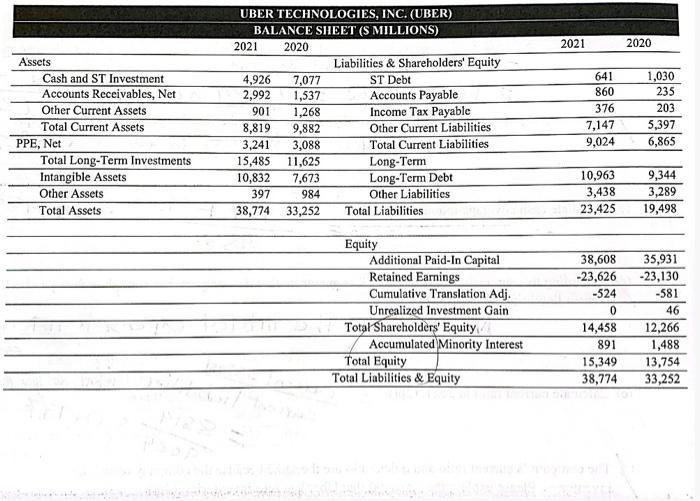
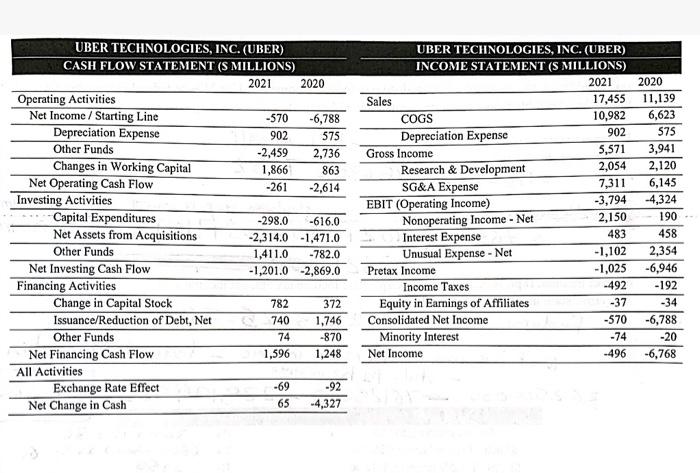
Below shows the balance sheet, cash flow statement, and income statement of Uber Technologies, Inc. (ticker: UBER) in 2020 and 2021. (a) Calculate accounts payable turnover in 2020 and 2021. (b)According to your answer to (a), how would you comment on the Uber's operating efficiency? (c) Calculate cash coverage ratio in 2021. (d)According to your answer to (c), could Uber guarantee that the company has enough cash to pay back current liabilities? Why? (e) Calculate current ratio in 2021. (f) The company's current ratio and quick ratio are the same because the company reports no inventories. Please. Explain the reason(s) that Uber has zero inventories. (g) Calculate cash flow from assets = Operating cash flow - Capital spending - Change in NWC. (Hint: Operating cash flow=-2400, Capital spending -3222, Change in NWC = -3222. You must show how to get these numbers. Directly using these three numbers to calculate cash flow from assets would not be accepted.). Assets Cash and ST Investment Accounts Receivables, Net Other Current Assets Total Current Assets PPE, Net Total Long-Term Investments Intangible Assets Other Assets Total Assets. UBER TECHNOLOGIES, INC. (UBER) BALANCE SHEET (S MILLIONS) 2021 2020 4,926 7,077 2,992 1,537 901 1,268 8,819 9,882 3,241 3,088 15,485 11,625 10,832 7,673 397 984 38,774 33,252 Liabilities & Shareholders' Equity ST Debt Accounts Payable Income Tax Payable Other Current Liabilities. Total Current Liabilities. Long-Term Long-Term Debt Other Liabilities Total Liabilities Equity Additional Paid-In Capital Retained Earnings Cumulative Translation Adj. Unrealized Investment Gain Total Shareholders' Equity Accumulated Minority Interest Total Equity Total Liabilities & Equity 2021 641 860 376 7,147 9,024 10,963 3,438 23,425 38,608 -23,626 -524 0 14,458 891 15,349 38,774 2020 1,030 235 203 5,397 6,865 9,344 3,289 19,498 35,931 -23,130 -581 46 12,266 1,488 13,754 33,252 UBER TECHNOLOGIES, INC. (UBER) CASH FLOW STATEMENT (S MILLIONS) 2021 Operating Activities Net Income / Starting Line Depreciation Expense Other Funds Changes in Working Capital Net Operating Cash Flow Investing Activities Capital Expenditures Net Assets from Acquisitions Other Funds Net Investing Cash Flow Financing Activities Change in Capital Stock Issuance/Reduction of Debt, Net Other Funds Net Financing Cash Flow All Activities Exchange Rate Effect Net Change in Cash -570 902 -2,459 1,866 -261 782 740 74 1,596 2020 -69 65 -6,788 575 -298.0 -616.0 -2,314.0 -1,471.0 1,411.0 -782.0 -1,201.0 -2,869.0 2,736 863 -2,614 372 1,746 -870 1,248 -92 -4,327 Sales UBER TECHNOLOGIES, INC. (UBER) INCOME STATEMENT (S MILLIONS) 2021 COGS Depreciation Expense Gross Income Research & Development SG&A Expense EBIT (Operating Income) Nonoperating Income - Net Interest Expense Unusual Expense - Net Pretax Income Income Taxes Equity in Earnings of Affiliates Consolidated Net Income Minority Interest Net Income 17,455 10,982 902 5,571 2,054 2020 -37 -570 -74 -496 11,139 6,623 575 3,941 2,120 7,311 6,145 -3,794 -4,324 2,150 190 483 458 -1,102 2,354 -1,025 -6,946 -492 -192 -34 -6,788 -20 -6,768
Step by Step Solution
There are 3 Steps involved in it
Step: 1
Ubers Financial Analysis 2020 2021 Extended Analysis a Accounts Payable Turnover and Operating Efficiency We can analyze Ubers accounts payable turnover APT to assess its supplier payment practices an...
Get Instant Access to Expert-Tailored Solutions
See step-by-step solutions with expert insights and AI powered tools for academic success
Step: 2

Step: 3

Ace Your Homework with AI
Get the answers you need in no time with our AI-driven, step-by-step assistance
Get Started


