Question
Below, you will find the Income statement and balance sheet of COBRA Inc for the end of 2016 and a table of industry averages. Calculate
Below, you will find the Income statement and balance sheet of COBRA Inc for the end of 2016 and a table of industry averages. Calculate and interpret the following ratios Current ratio Inventory turnover ratio Total asset turnover ratio Times interest earned Return on assets Sustainable growth rate
For each ratio explain why the ratio can be interpreted as positive or negative compared to the economy. Calculate Return on equity and by using the dupont identity explain why ROE is above/below the industry averages.( Like the comparison between Yahoo and Google example in the slides.)
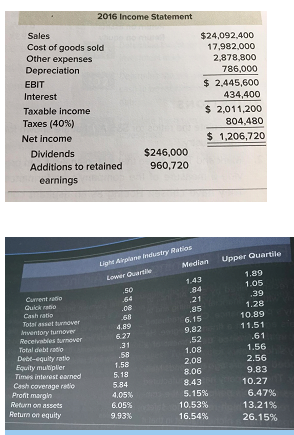
2016 Income Statement Sales Cost of goods sold Other expenses Depreciation EBIT Interest Taxable income Taxes (40%) Net income Dividends Additions to retained earnings $24,092.400 17.982,000 2,878,800 786,000 $ 2.445,600 434,400 $ 2,011,200 804,480 $ 1,206,720 $246,000 960,720 Light Airplane Industry Ruties Lower Quartie Median 50 Upper Quartile 1.89 1.05 .39 1.28 10.89 11.51 .61 08 Currento Quick to Cash ratio Total asset urnover Inventory tumore Receivables turnover Total debt radio Debe-equity ratio Equity multiplier Time interest earned Cash coverage radio Profit margin Return on assets Return on equity 21 .85 6.15 9.82 .52 1.08 2.08 8.06 4.89 6.27 31 .58 1.58 5.18 5.84 4.05% 6.05% 9.93% 8.43 5.15% 10.53% 16.54% 1.56 2.56 9.83 10.27 6.47% 13.21% 26.15% 2016 Income Statement Sales Cost of goods sold Other expenses Depreciation EBIT Interest Taxable income Taxes (40%) Net income Dividends Additions to retained earnings $24,092.400 17.982,000 2,878,800 786,000 $ 2.445,600 434,400 $ 2,011,200 804,480 $ 1,206,720 $246,000 960,720 Light Airplane Industry Ruties Lower Quartie Median 50 Upper Quartile 1.89 1.05 .39 1.28 10.89 11.51 .61 08 Currento Quick to Cash ratio Total asset urnover Inventory tumore Receivables turnover Total debt radio Debe-equity ratio Equity multiplier Time interest earned Cash coverage radio Profit margin Return on assets Return on equity 21 .85 6.15 9.82 .52 1.08 2.08 8.06 4.89 6.27 31 .58 1.58 5.18 5.84 4.05% 6.05% 9.93% 8.43 5.15% 10.53% 16.54% 1.56 2.56 9.83 10.27 6.47% 13.21% 26.15%Step by Step Solution
There are 3 Steps involved in it
Step: 1
Get Instant Access to Expert-Tailored Solutions
See step-by-step solutions with expert insights and AI powered tools for academic success
Step: 2
Step: 3
Ace Your Homework with AI
Get the answers you need in no time with our AI-driven, step-by-step assistance
Get Started