Answered step by step
Verified Expert Solution
Question
1 Approved Answer
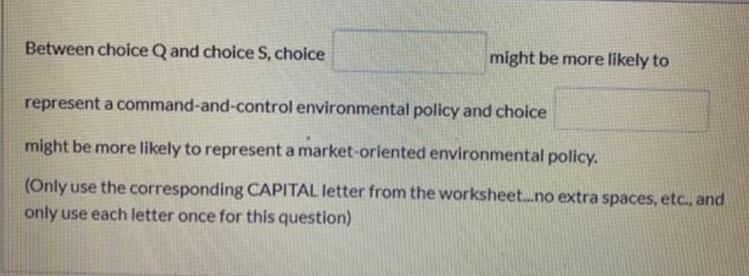
Between choice Q and choice S, choice might be more likely to represent a command-and-control environmental policy and choice might be more likely to


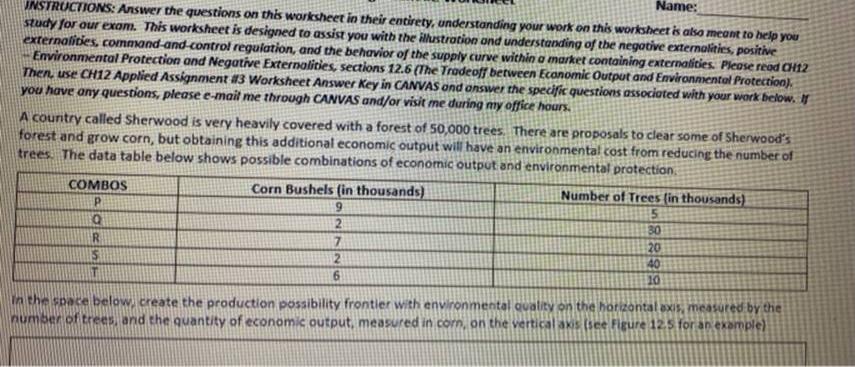
Between choice Q and choice S, choice might be more likely to represent a command-and-control environmental policy and choice might be more likely to represent a market-oriented environmental policy. (Only use the corresponding CAPITAL letter from the worksheet...no extra spaces, etc., and only use each letter once for this question) Name: INSTRUCTIONS: Answer the questions on this worksheet in their entirety, understanding your work on this worksheet is also meant to help you study for our exam. This worksheet is designed to assist you with the illustration and understanding of the negative externalities, positive externalities, command-and-control regulation, and the behavior of the supply curve within a market containing externalities. Please read CH12 Environmental Protection and Negative Externalities, sections 12.6 (The Tradeoff between Economic Output and Environmental Protection). Then, use CH12 Applied Assignment #3 Worksheet Answer Key in CANVAS and answer the specific questions associated with your work below. If you have any questions, please e-mail me through CANVAS and/or visit me during my office hours. A country called Sherwood is very heavily covered with a forest of 50,000 trees. There are proposals to clear some of Sherwood's forest and grow corn, but obtaining this additional economic output will have an environmental cost from reducing the number of trees. The data table below shows possible combinations of economic output and environmental protection. COMBOS P Q R $ T Corn Bushels (in thousands) 9 2 7 2 6 Number of Trees (in thousands) 5 30 20 40 10 in the space below, create the production possibility frontier with environmental quality on the horizontal axis, measured by the number of trees, and the quantity of economic output, measured in corn, on the vertical axis (see Figure 12.5 for an example)
Step by Step Solution
★★★★★
3.46 Rating (153 Votes )
There are 3 Steps involved in it
Step: 1
Sol i Choice S As 40 tress can be saved over the production of o...
Get Instant Access to Expert-Tailored Solutions
See step-by-step solutions with expert insights and AI powered tools for academic success
Step: 2

Step: 3

Ace Your Homework with AI
Get the answers you need in no time with our AI-driven, step-by-step assistance
Get Started


