Between these two company stocks, and considering the information provided below, which is a better investment and why? Please explain conclusion regarding valuation, risk, and ratio analysis.
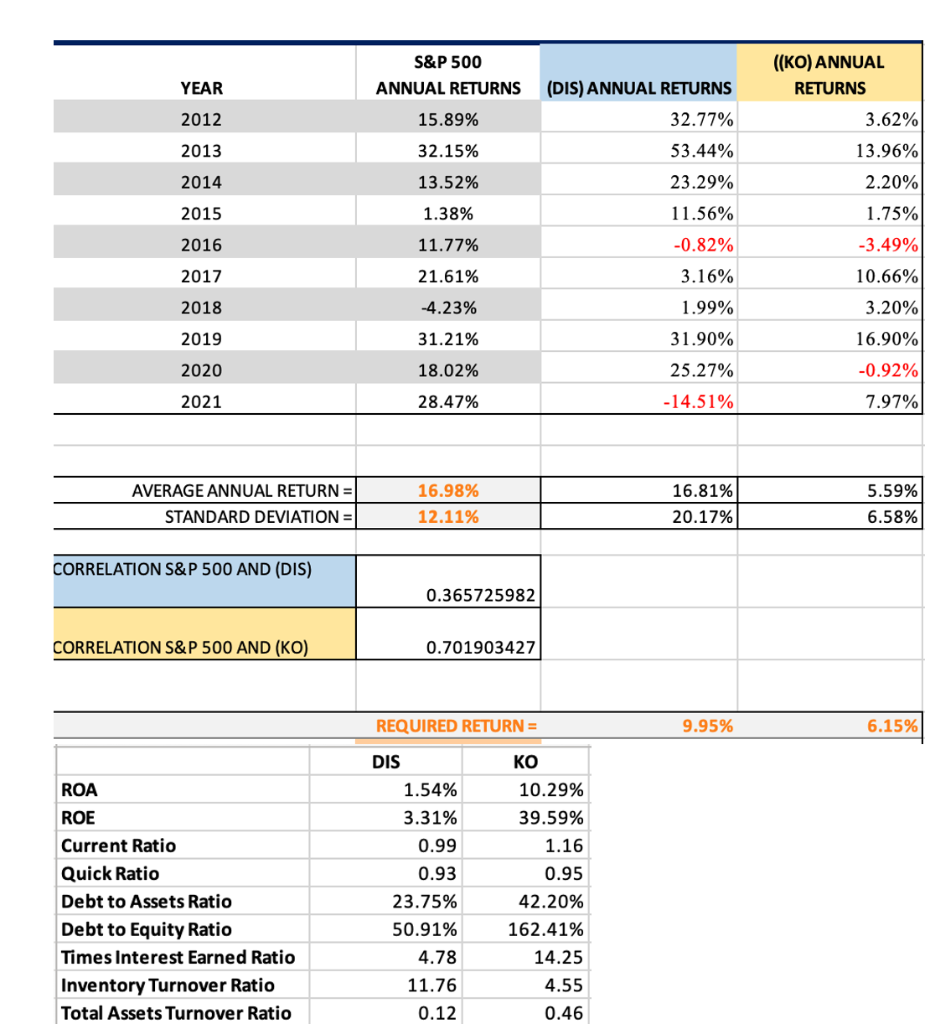
\begin{tabular}{|c|c|r|r|} \hline & S\&P 500 & & ((KO)ANNUAL \\ \hline YEAR & ANNUAL RETURNS & (DIS)ANNUAL RETURNS & \multicolumn{1}{|c|}{ RETURNS } \\ \hline 2012 & 15.89% & 32.77% & 3.62% \\ \hline 2013 & 32.15% & 53.44% & 13.96% \\ \hline 2014 & 13.52% & 23.29% & 2.20% \\ \hline 2015 & 1.38% & 11.56% & 1.75% \\ \hline 2016 & 11.77% & 0.82% & 3.49% \\ \hline 2017 & 21.61% & 3.16% & 10.66% \\ \hline 2018 & 4.23% & 1.99% & 3.20% \\ \hline 2020 & 31.21% & 31.90% & 16.90% \\ \hline 2021 & 18.02% & 25.27% & 0.92% \\ \hline & 28.47% & 14.51% & 7.97% \\ \hline \end{tabular} \begin{tabular}{r|r|r|r|} \hline AVERAGE ANNUAL RETURN = & 16.98% & 16.81% & 5.59% \\ \hline STANDARD DEVIATION = & 12.11% & 20.17% & 6.58% \\ \hline \end{tabular} \begin{tabular}{l|r|} \hline CORRELATION S\&P 500 AND (DIS) & 0.365725982 \\ \hline & \\ CORRELATION S\&P 500 AND (KO) & 0.701903427 \\ \hline \end{tabular} \begin{tabular}{|l|r|r|} \hline \multicolumn{2}{|c|}{ REQUIRED RETURN = } \\ \hline & \multicolumn{1}{|c|}{ DIS } & \multicolumn{1}{c|}{ KO } \\ \hline ROA & 1.54% & 10.29% \\ \hline ROE & 3.31% & 39.59% \\ \hline Current Ratio & 0.99 & 1.16 \\ \hline Quick Ratio & 0.93 & 0.95 \\ \hline Debt to Assets Ratio & 23.75% & 42.20% \\ \hline Debt to Equity Ratio & 50.91% & 162.41% \\ \hline Times Interest Earned Ratio & 4.78 & 14.25 \\ \hline Inventory Turnover Ratio & 11.76 & 4.55 \\ \hline Total Assets Turnover Ratio & 0.12 & 0.46 \\ \hline \end{tabular} \begin{tabular}{|c|c|r|r|} \hline & S\&P 500 & & ((KO)ANNUAL \\ \hline YEAR & ANNUAL RETURNS & (DIS)ANNUAL RETURNS & \multicolumn{1}{|c|}{ RETURNS } \\ \hline 2012 & 15.89% & 32.77% & 3.62% \\ \hline 2013 & 32.15% & 53.44% & 13.96% \\ \hline 2014 & 13.52% & 23.29% & 2.20% \\ \hline 2015 & 1.38% & 11.56% & 1.75% \\ \hline 2016 & 11.77% & 0.82% & 3.49% \\ \hline 2017 & 21.61% & 3.16% & 10.66% \\ \hline 2018 & 4.23% & 1.99% & 3.20% \\ \hline 2020 & 31.21% & 31.90% & 16.90% \\ \hline 2021 & 18.02% & 25.27% & 0.92% \\ \hline & 28.47% & 14.51% & 7.97% \\ \hline \end{tabular} \begin{tabular}{r|r|r|r|} \hline AVERAGE ANNUAL RETURN = & 16.98% & 16.81% & 5.59% \\ \hline STANDARD DEVIATION = & 12.11% & 20.17% & 6.58% \\ \hline \end{tabular} \begin{tabular}{l|r|} \hline CORRELATION S\&P 500 AND (DIS) & 0.365725982 \\ \hline & \\ CORRELATION S\&P 500 AND (KO) & 0.701903427 \\ \hline \end{tabular} \begin{tabular}{|l|r|r|} \hline \multicolumn{2}{|c|}{ REQUIRED RETURN = } \\ \hline & \multicolumn{1}{|c|}{ DIS } & \multicolumn{1}{c|}{ KO } \\ \hline ROA & 1.54% & 10.29% \\ \hline ROE & 3.31% & 39.59% \\ \hline Current Ratio & 0.99 & 1.16 \\ \hline Quick Ratio & 0.93 & 0.95 \\ \hline Debt to Assets Ratio & 23.75% & 42.20% \\ \hline Debt to Equity Ratio & 50.91% & 162.41% \\ \hline Times Interest Earned Ratio & 4.78 & 14.25 \\ \hline Inventory Turnover Ratio & 11.76 & 4.55 \\ \hline Total Assets Turnover Ratio & 0.12 & 0.46 \\ \hline \end{tabular}