

Question: Bezier Curve Q 1 . Plot the Bezier curve using the following control points ( 2 , 0 ) , ( 4 , 3 )
Bezier Curve
Q Plot the Bezier curve using the following control points
and
MATLAB program
;;;;;; Representing the above control points in matrix form syms u
BernsteinMatrix Gives the equation for degree bazier curve
Beziercurvesimplify Gives two separate equation for x and y
coordinates by substituting the control points
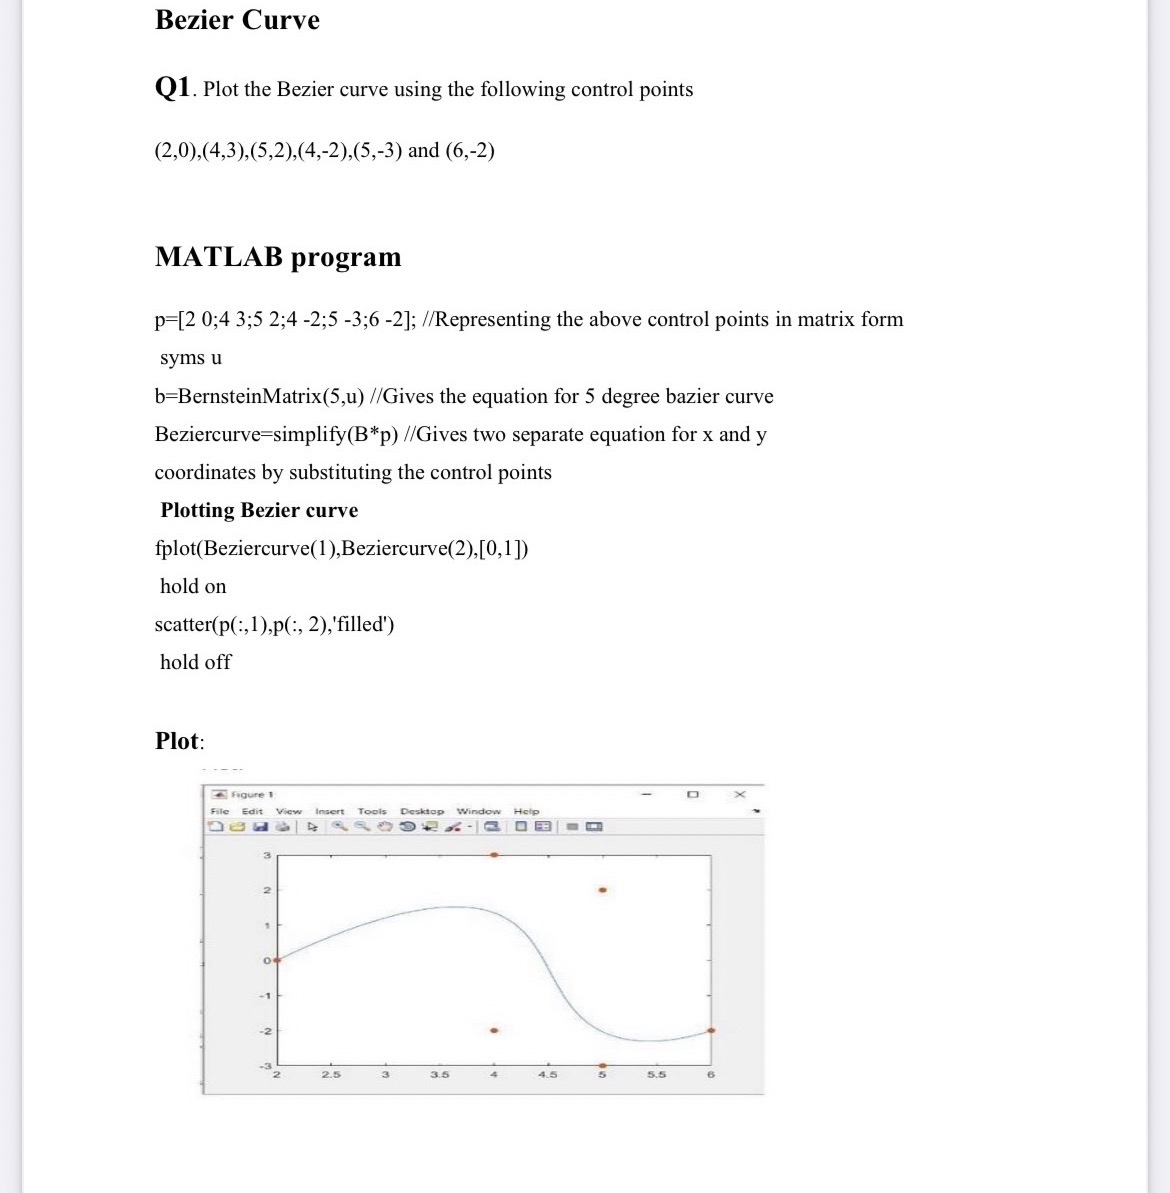
Plotting Bezier curve
fplotBeziercurveBeziercurve
hold on
scatterp:p:'filled'
hold off
Plot:
Step by Step Solution
There are 3 Steps involved in it
1 Expert Approved Answer
Step: 1 Unlock

Question Has Been Solved by an Expert!
Get step-by-step solutions from verified subject matter experts
Step: 2 Unlock
Step: 3 Unlock