

Answered step by step
Verified Expert Solution
Question
1 Approved Answer
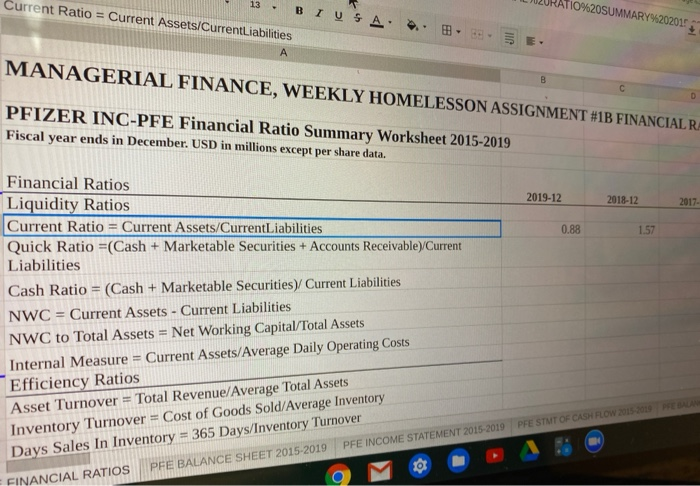
BI USA Current Ratio = Current Assets/CurrentLiabilities 13 - 10%20SUMMARY%202015 5 E MANAGERIAL FINANCE, WEEKLY HOMELESSON ASSIGNMENT #13 FINANCIAL RA B D PFIZER INC-PFE Financial
Step by Step Solution
There are 3 Steps involved in it
Step: 1

Get Instant Access to Expert-Tailored Solutions
See step-by-step solutions with expert insights and AI powered tools for academic success
Step: 2

Step: 3
Ace Your Homework with AI
Get the answers you need in no time with our AI-driven, step-by-step assistance
Get Started
Quantitative Finance: An Object-Oriented Approach In C++
Authors: Erik Schlogl, Dilip B. Madan
1st Edition
1584884797, 978-1584884798