

Answered step by step
Verified Expert Solution
Question
1 Approved Answer
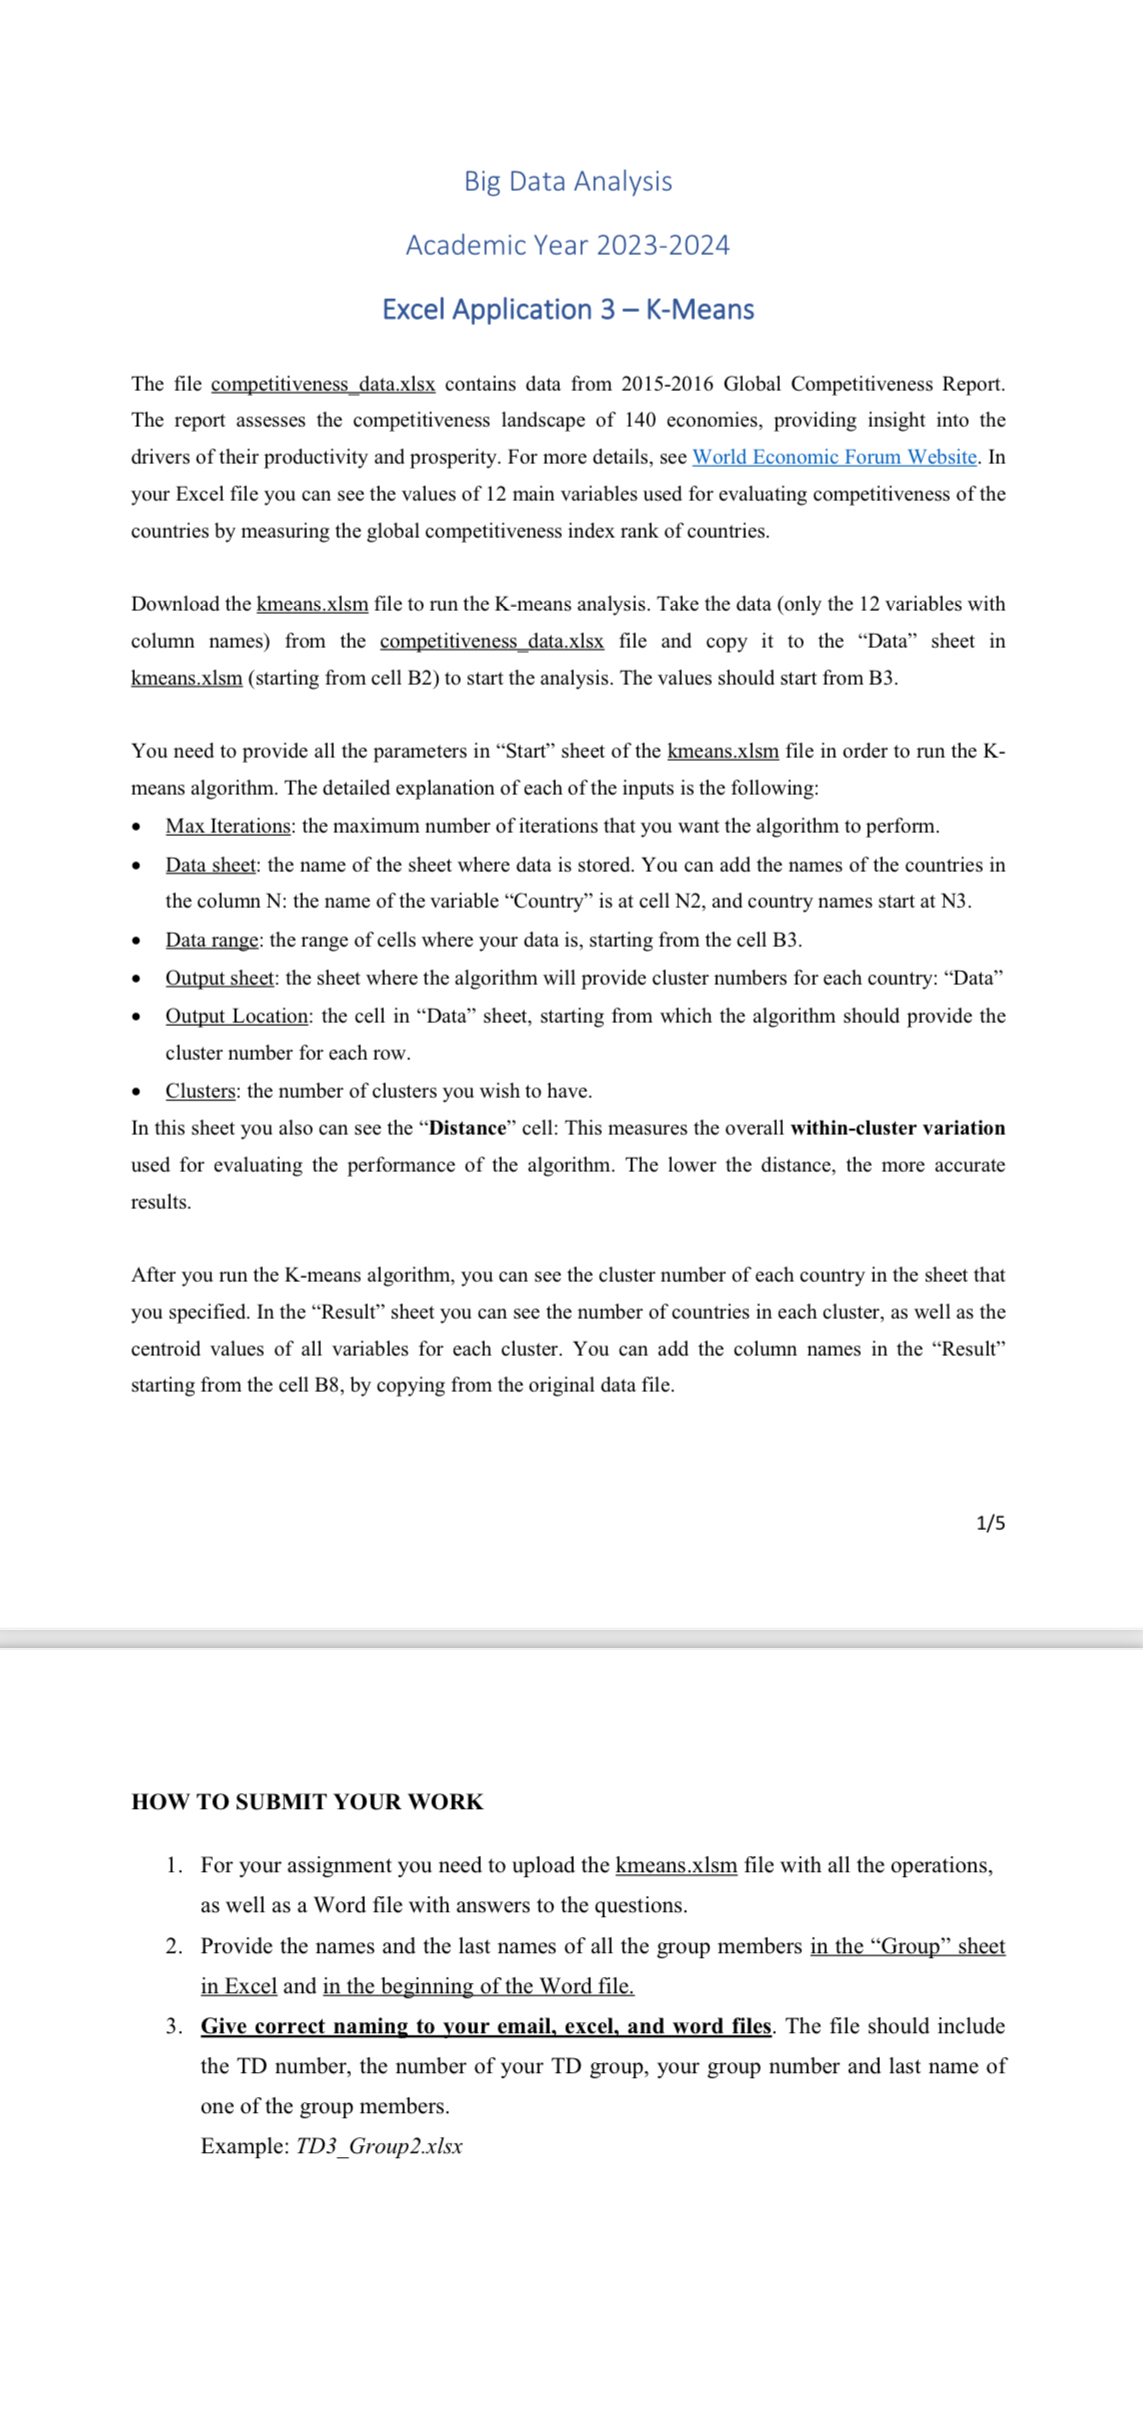
Big Data Analysis Academic Year 2 0 2 3 - 2 0 2 4 Excel Application 3 - K - Means The file competitiveness data.xlsx
Big Data Analysis
Academic Year
Excel Application KMeans
The file competitiveness data.xlsx contains data from Global Competitiveness Report. The report assesses the competitiveness landscape of economies, providing insight into the drivers of their productivity and prosperity. For more details, see World Economic Forum Website. In your Excel file you can see the values of main variables used for evaluating competitiveness of the countries by measuring the global competitiveness index rank of countries.
Download the kmeans.xlsm file to run the Kmeans analysis. Take the data only the variables with column names from the competitiveness data.xlsx file and copy it to the "Data" sheet in kmeans.xlsm starting from cell B to start the analysis. The values should start from B
You need to provide all the parameters in "Start" sheet of the kmeans.xlsm file in order to run the Kmeans algorithm. The detailed explanation of each of the inputs is the following:
Max Iterations: the maximum number of iterations that you want the algorithm to perform.
Data sheet: the name of the sheet where data is stored. You can add the names of the countries in the column N: the name of the variable "Country" is at cell N and country names start at N
Data range: the range of cells where your data is starting from the cell B
Output sheet: the sheet where the algorithm will provide cluster numbers for each country: "Data"
Output Location: the cell in "Data" sheet, starting from which the algorithm should provide the cluster number for each row.
Clusters: the number of clusters you wish to have.
In this sheet you also can see the "Distance" cell: This measures the overall withincluster variation used for evaluating the performance of the algorithm. The lower the distance, the more accurate results.
After you run the means algorithm, you can see the cluster number of each country in the sheet that you specified. In the "Result" sheet you can see the number of countries in each cluster, as well as the centroid values of all variables for each cluster. You can add the column names in the "Result" starting from the cell B by copying from the original data file.
HOW TO SUBMIT YOUR WORK
For your assignment you need to upload the kmeans.xlsm file with all the operations, as well as a Word file with answers to the questions.
Provide the names and the last names of all the group members in the "Group" sheet in Excel and in the beginning of the Word file.
Give correct naming to vour email, excel, and word files. The file should include the TD number, the number of your TD group, your group number and last name of one of the group members.
Example: TDGroupxlsx
Step by Step Solution
There are 3 Steps involved in it
Step: 1

Get Instant Access to Expert-Tailored Solutions
See step-by-step solutions with expert insights and AI powered tools for academic success
Step: 2

Step: 3
Ace Your Homework with AI
Get the answers you need in no time with our AI-driven, step-by-step assistance
Get Started
Database Benchmarking And Stress Testing An Evidence Based Approach To Decisions On Architecture And Technology
Authors: Bert Scalzo
1st Edition
148424009X, 978-1484240090