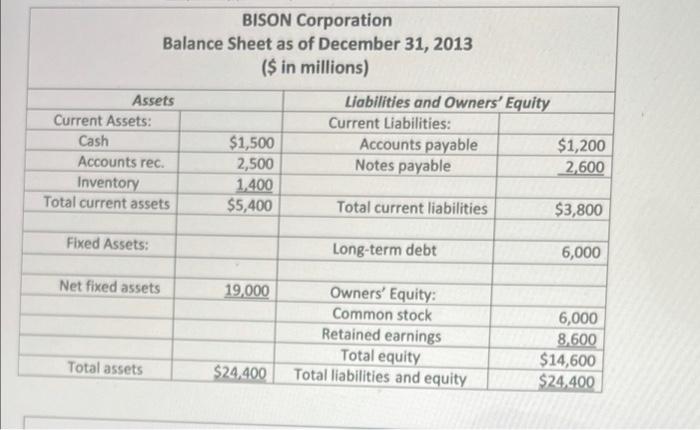
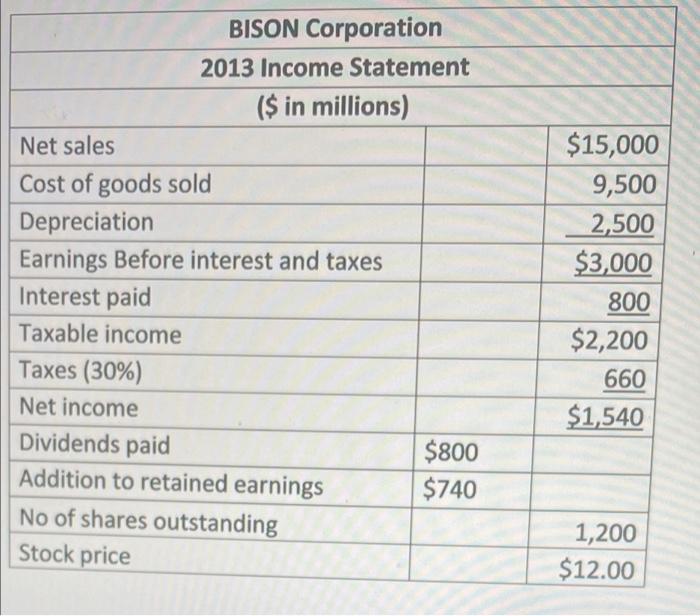
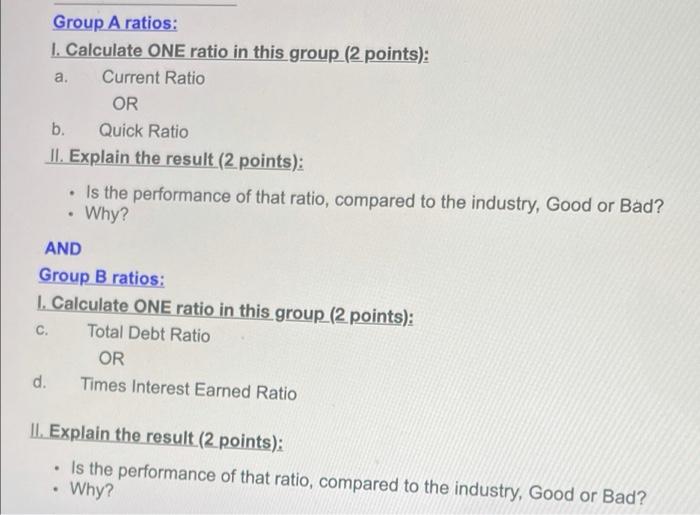
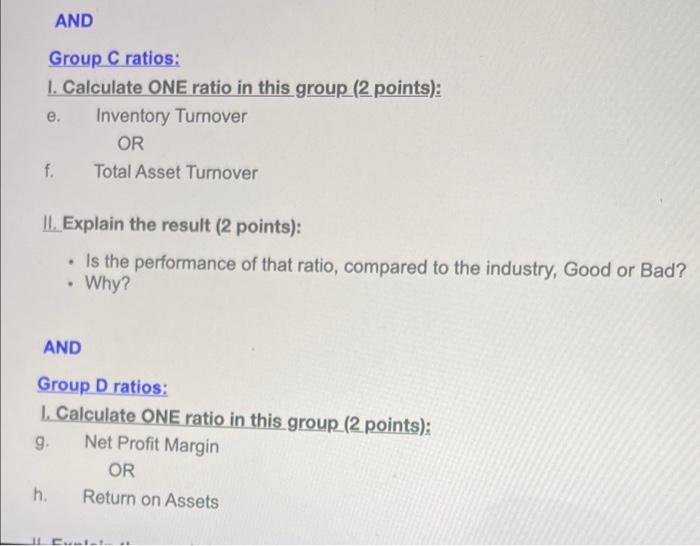
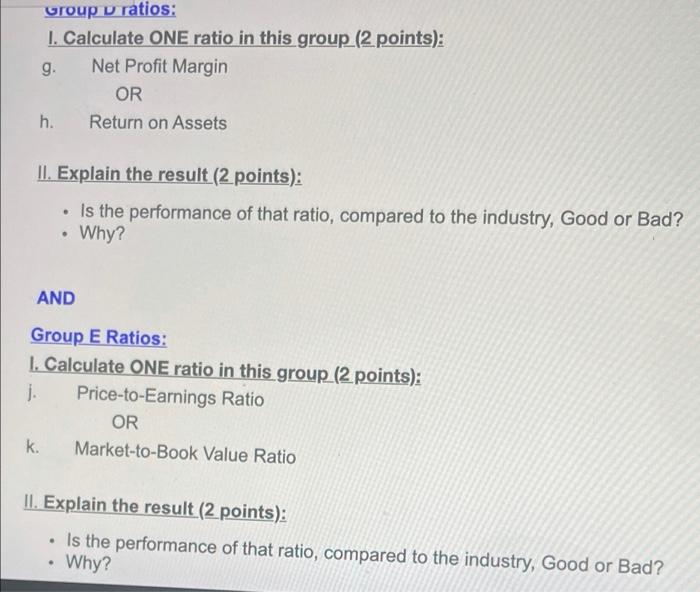
BISON Corporation Balance Sheet as of December 31, 2013 ($ in millions) Assets Current Assets: Cash Accounts rec. Inventory Total current assets Liabilities and Owners' Equity Current Liabilities: Accounts payable Notes payable $1,500 2,500 1,400 $5,400 $1,200 2,600 Total current liabilities $3,800 Fixed Assets: Long-term debt 6,000 Net fixed assets 19.000 Owners' Equity: Common stock Retained earnings Total equity Total liabilities and equity 6,000 8,600 $14,600 $24.400 Total assets $24,400 BISON Corporation 2013 Income Statement ($ in millions) Net sales Cost of goods sold Depreciation Earnings Before interest and taxes Interest paid Taxable income Taxes (30%) Net income Dividends paid $800 Addition to retained earnings $740 No of shares outstanding Stock price $15,000 9,500 2,500 $3,000 800 $2,200 660 $1,540 1,200 $12.00 Current ratio Quick ratio Total asset turnover total debt ratio limes interest earned Industry averages 1.89 times Inventory turnover 1.05 Net profit margin 1.28 Return on asset .61 Price earnings ratio 9.83 Market to book value 1.28 6.47% 13,21% 2.26 2.12 Group A ratios: 1. Calculate ONE ratio in this group (2 points): a. Current Ratio OR b. Quick Ratio II. Explain the result (2 points): Is the performance of that ratio, compared to the industry, Good or Bad? Why? AND Group B ratios: 1. Calculate ONE ratio in this group (2 points): c. Total Debt Ratio OR d. Times Interest Earned Ratio II. Explain the result (2 points): Is the performance of that ratio, compared to the industry, Good or Bad? Why? AND Group C ratios: 1. Calculate ONE ratio in this group (2 points): e. Inventory Turnover OR f. Total Asset Turnover II. Explain the result (2 points): Is the performance of that ratio, compared to the industry, Good or Bad? Why? AND Group D ratios: 1. Calculate ONE ratio in this group (2 points): g Net Profit Margin OR h. Return on Assets 11 Group u ratios: 1. Calculate ONE ratio in this group (2 points): g. Net Profit Margin OR h. Return on Assets II. Explain the result (2 points): Is the performance of that ratio, compared to the industry, Good or Bad? Why? AND Group E Ratios: 1. Calculate ONE ratio in this group (2 points): Price-to-Earnings Ratio OR k. Market-to-Book Value Ratio II. Explain the result (2 points): Is the performance of that ratio, compared to the industry, Good or Bad? Why
