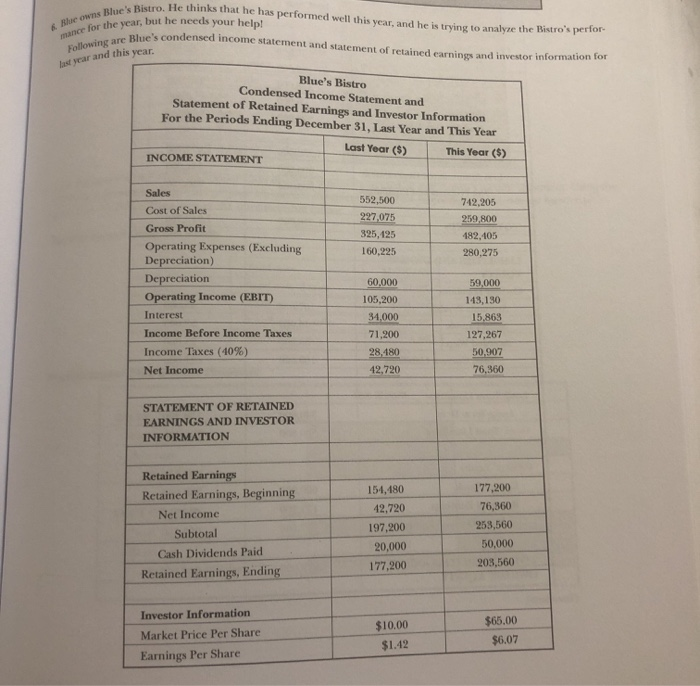
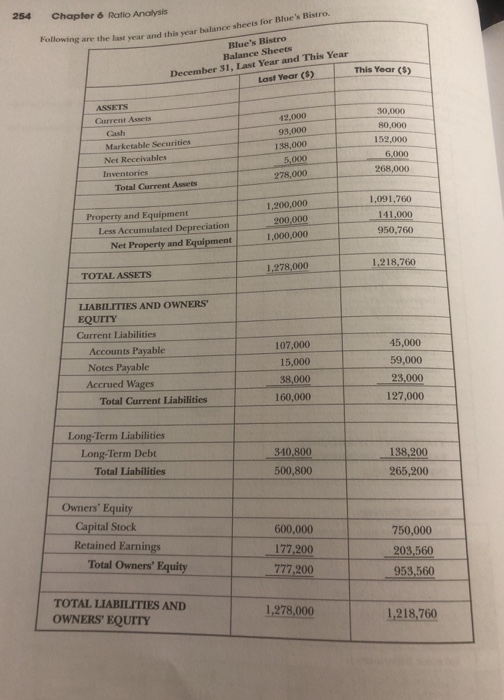
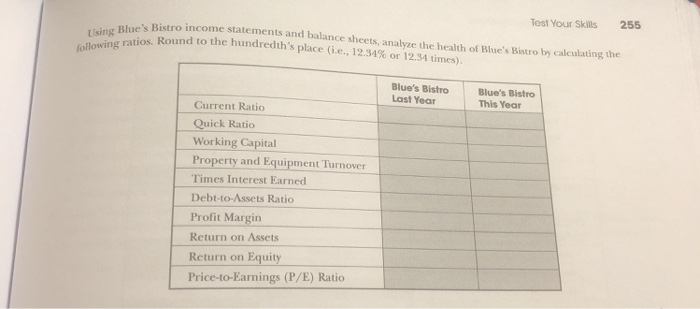
Bistro. He thinks that he has performed well this year, and he is trying to analyze the Bistro's perfor Blue owns Blue's Bis mance for the yea for the year, but he needs your help! Blue's condensed come statement and statement of retained earnings and investor information for last year and this year. Blue's Bistro Condensed Income Statement and Statement of Retained Earnings and Investor Information For the Periods Ending December 31, Last Year and This Year Last Year ($) This Year ($) INCOME STATEMENT Sales 552,500 227,075 325, 125 160,225 742,205 259,800 182,405 280,275 Cost of Sales Gross Profit Operating Expenses (Excluding Depreciation) Depreciation Operating Income (EBIT) Interest Income Before Income Taxes Income Taxes (40%) Net Income 60.000 105,200 34,000 71,200 28,480 42,720 59,000 143,130 15,863 127,267 50,907 76,360 STATEMENT OF RETAINED EARNINGS AND INVESTOR INFORMATION 177,200 Retained Earnings Retained Earnings, Beginning Net Income Subtotal Cash Dividends Paid Retained Earnings, Ending 154,180 42,720 197,200 20,000 177,200 76,360 253,560 50,000 203,560 $65.00 Investor Information Market Price Per Share Earnings Per Share $10.00 $1.42 $6.07 254 Chapter 6 Ratio Analysis Following are the last year and wing are the last year and this war balance sheets for Blue's Bistro. Blue's Bistro Balance Sheets December 31, Last Year and This Year Last Year ($) This Year ($) 30.000 42.000 93,000 ASSETS Current Assets Cash Marketable Securities Net Receivables Inventories Total Current Assets 138.000 5.000 278,000 80,000 12.000 6,000 268,000 Property and Equipment Less Accumulated Depreciation Net Property and Equipment 1,200,000 200,000 1,000,000 1,091,760 141,000 950,760 1,218,760 1,278.000 TOTAL ASSETS LIABILITIES AND OWNERS' EQUITY Current Liabilities Accounts Payable Notes Payable Accrued Wages Total Current Liabilities 107.000 15,000 38,000 160,000 45,000 59,000 23,000 127,000 Long-Term Liabilities Long-Term Debt Total Liabilities 340,800 138,200 500,800 265,200 Owners' Equity Capital Stock Retained Earnings Total Owners' Equity 600.000 177,200 777,200 750,000 203,560 953,560 TOTAL LIABILITIES AND OWNERS' EQUITY 1,278,000 1,218,760 Test Your Skills 255 Blue's Bistro income statements and bal Using Blues s and balance sheets, analyze the health of Blue's Bistro buy calculating the ins. Round to the hundredth's place (ie., 12.34% or 12.34 times) following ratios. Round to Blue's Bistro Last Year Blue's Bistro This Year Current Ratio Quick Ratio Working Capital Property and Equipment Turnover Times Interest Earned Debt-to-Assets Ratio Profit Margin Return on Assets Return on Equity Price-to-Earnings (P/E) Ratio


