Answered step by step
Verified Expert Solution
Link Copied!

Question

1 Approved Answer

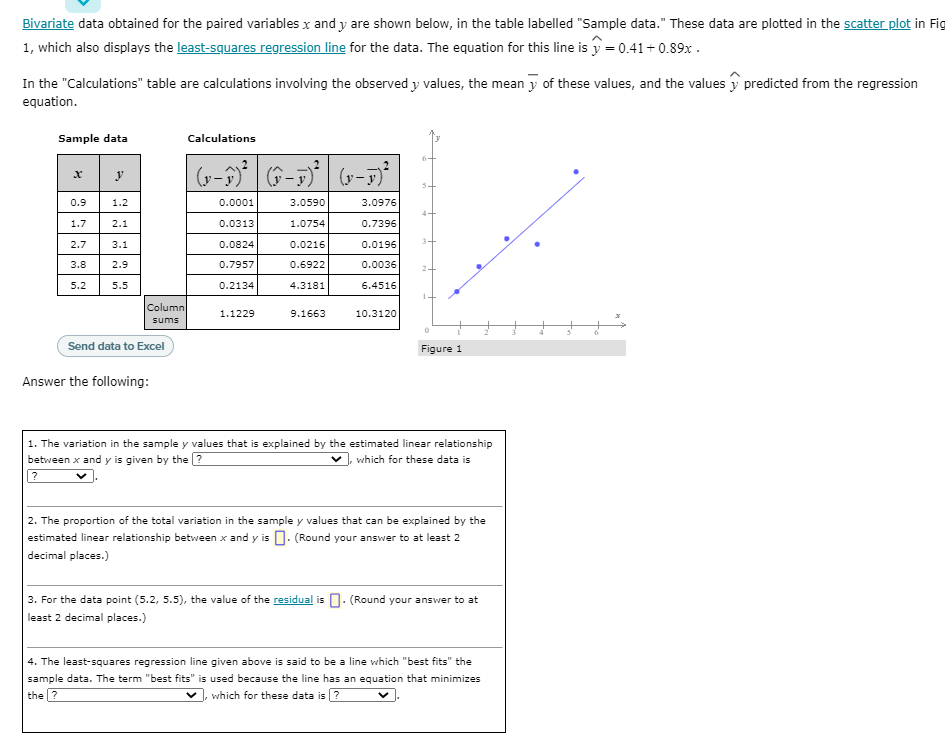
Bivariate data obtained for the paired variables x and y are shown below, in the table labelled Sample data. These data are plotted in the

image text in transcribed
Bivariate data obtained for the paired variables x and y are shown below, in the table labelled "Sample data." These data are plotted in the scatter plot in Fig 1, which also displays the least-squares regression line for the data. The equation for this line is y = 0.41 + 0.89x . In the "Calculations" table are calculations involving the observed y values, the mean y of these values, and the values y predicted from the regression equation. Sample data Calculations ( 1 - 7 )- 0.9 1.2 0.0001 3.0590 3.0976 1.7 2.1 0.0313 1.0754 0.7396 2.7 3.1 0.0824 0.0216 0.0196 3.8 2.9 0.7957 0.6922 0.0036 5.2 5.5 0.213- 4.3181 5.4516 Column 1.1229 9.1663 10.3120 sums Send data to Excel Figure 1 Answer the following: 1. The variation in the sample y values that is explained by the estimated linear relationship between x and y is given by the |? , which for these data is v . 2. The proportion of the total variation in the sample y values that can be explained by the estimated linear relationship between x and y is |. (Round your answer to at least 2 decimal places.) 3. For the data point (5.2, 5.5), the value of the residual is . (Round your answer to at least 2 decimal places.) 4. The least-squares regression line given above is said to be a line which "best fits" the sample data. The term "best fits" is used because the line has an equation that minimizes the | ? , which for these data is |

Step by Step Solution

There are 3 Steps involved in it

Step: 1

blur-text-image

Get Instant Access to Expert-Tailored Solutions

See step-by-step solutions with expert insights and AI powered tools for academic success

Step: 2

blur-text-image

Step: 3

blur-text-image

Ace Your Homework with AI

Get the answers you need in no time with our AI-driven, step-by-step assistance

Get Started

Recommended Textbook for

Interconnection Networks

Authors: J C Bermond

1st Edition

1483295273, 9781483295275

More Books

Students also viewed these Mathematics questions

Question

Which component(s) would you use to allow the user to enter text?

Answered: 1 week ago