Answered step by step
Verified Expert Solution
Question
1 Approved Answer
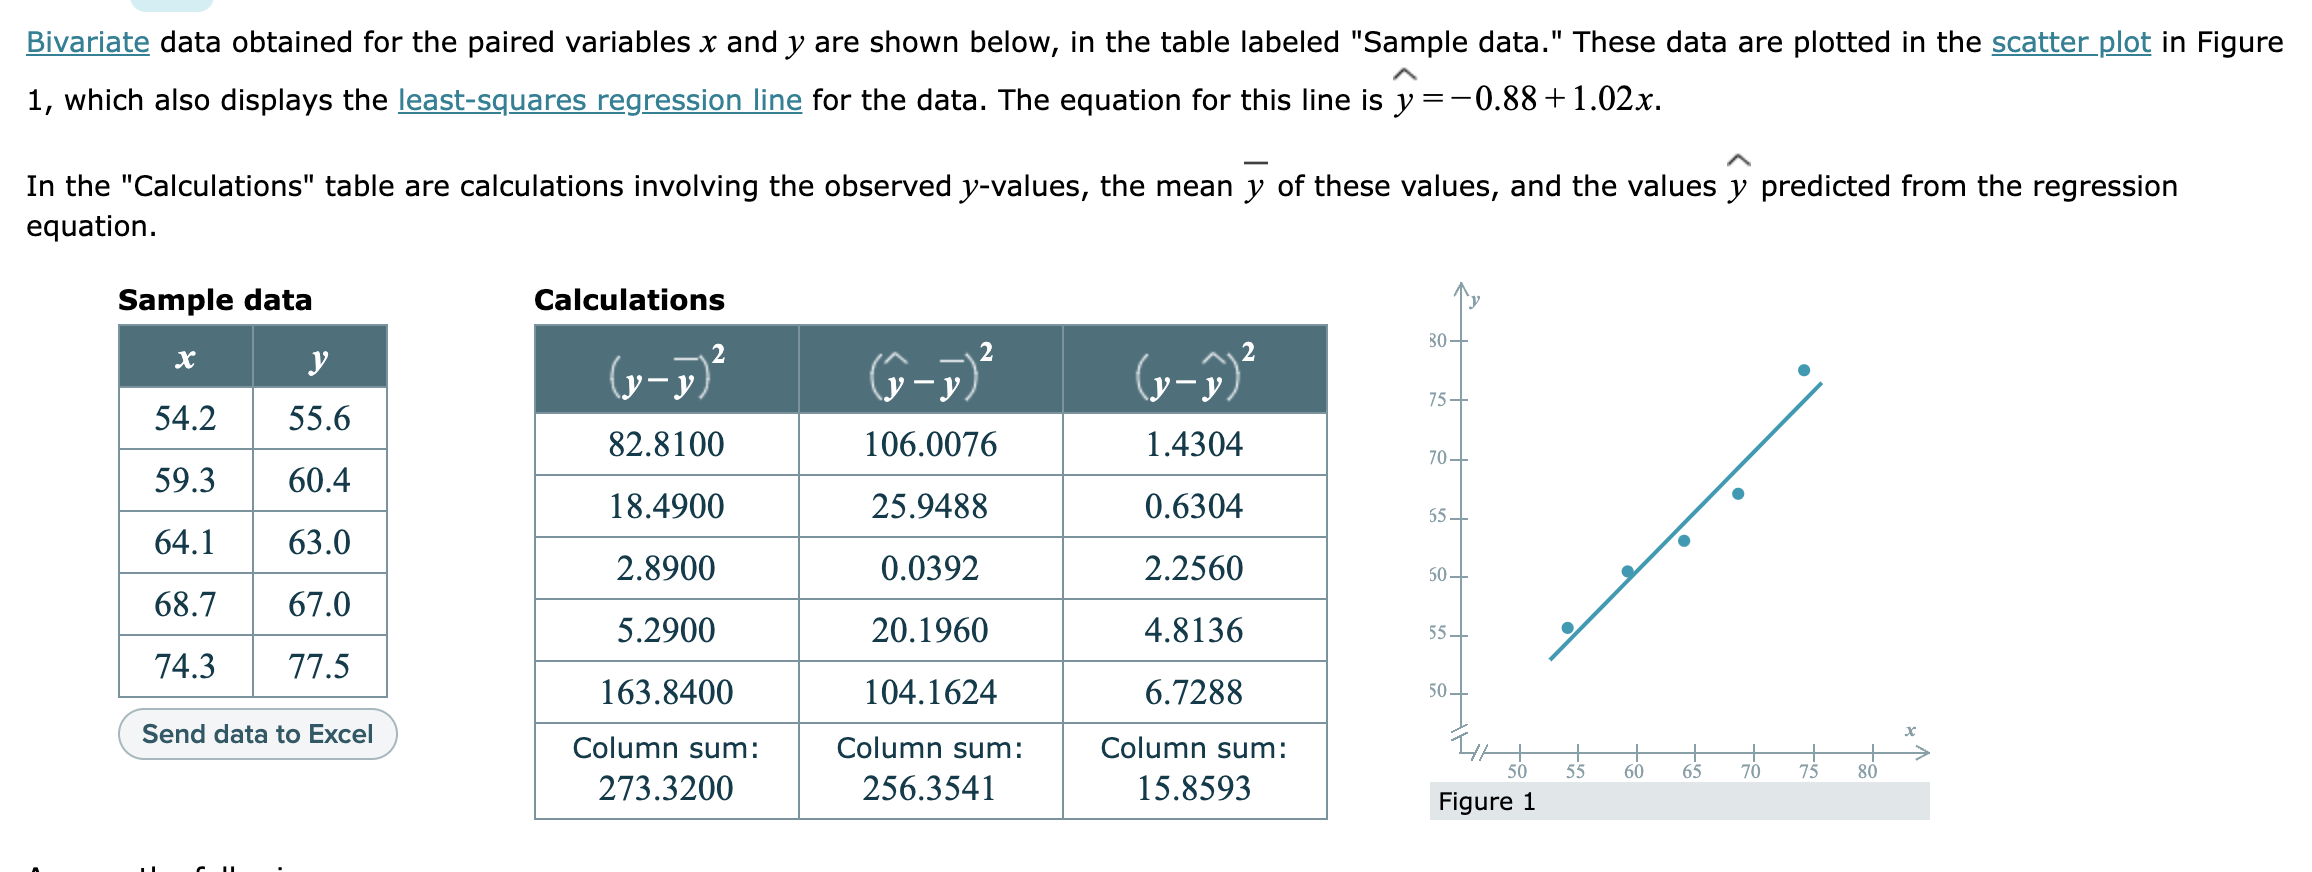
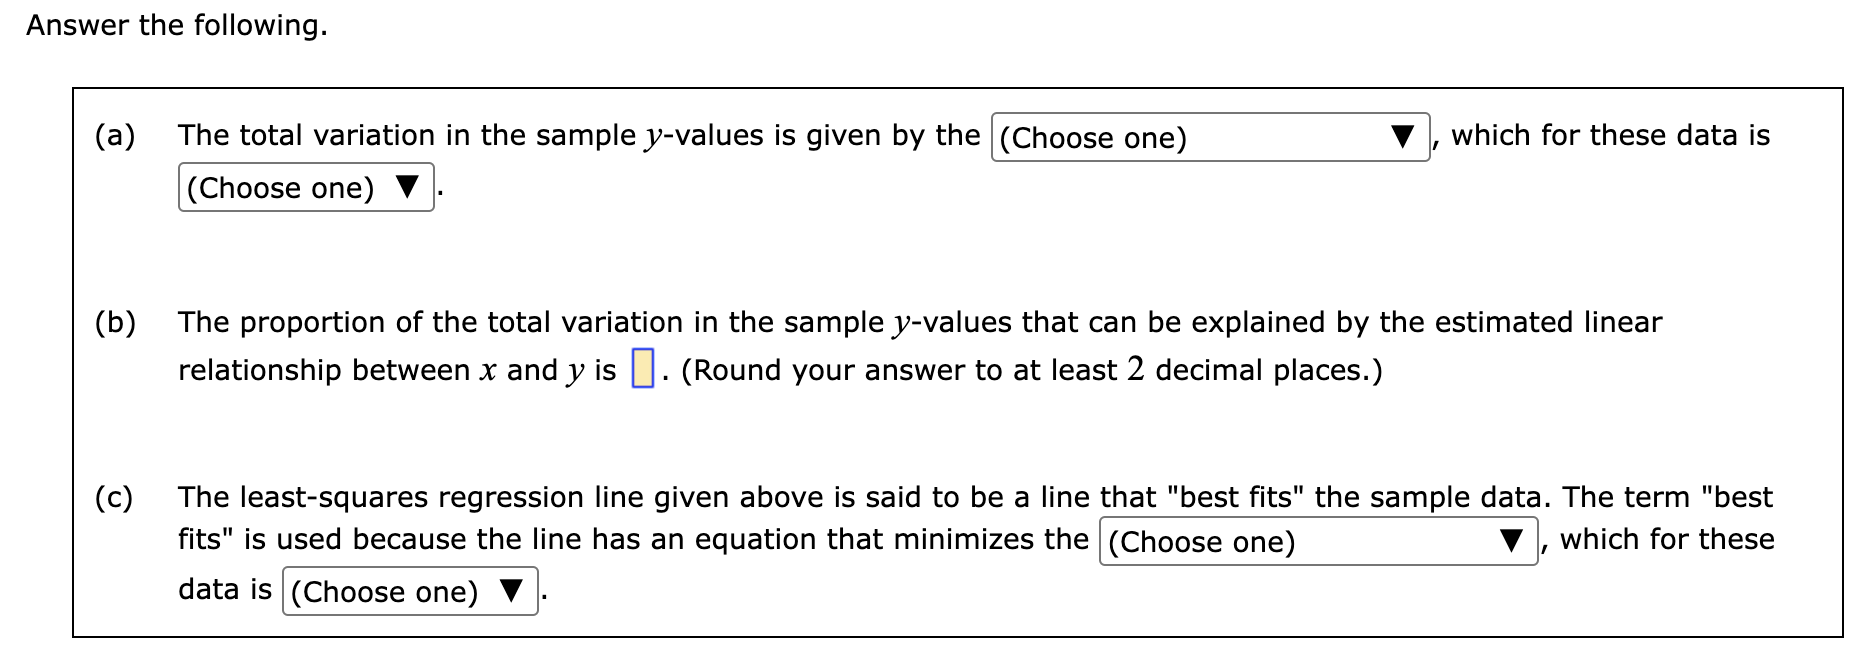
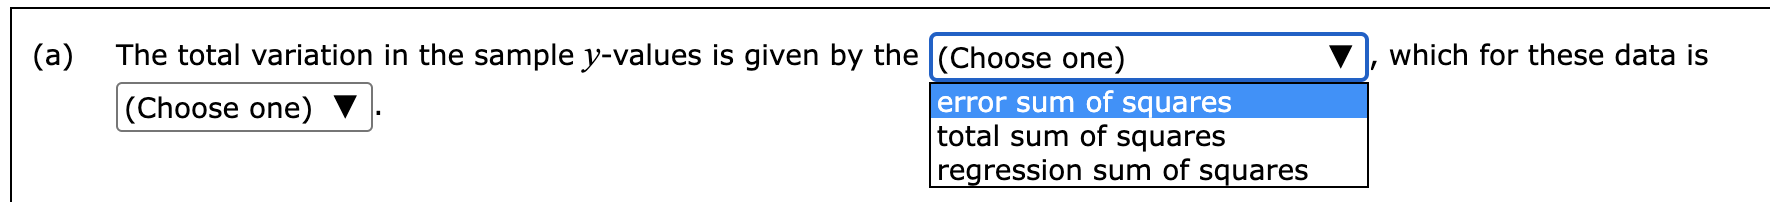
Bivariate data obtained for the paired variables x and y are shown below, in the table labeled Sample data.'I These data are plotted in the
Bivariate data obtained for the paired variables x and y are shown below, in the table labeled "Sample data.'I These data are plotted in the scatter plot in Figure A 1, which also displays the leastsquares regression line for the data. The equation for this line is y =0.88 +1.02x. _ A In the "Calculations" table are calculations involving the observed y-values, the mean y of these values, and the values y predicted from the regression equation. Sample data Calculations y (y-y) (yy) (yy) 75-. . 54.2 55.6 323100 1060076 1.4304 70-. 59.3 60.4 18.4900 259488 0.6304 35- . 64.1 63.0 18900 o_o392 2.2560 30" . 68.7 67.0 52900 20_1960 4.8136 35 ' 74.3 77.5 163.8400 104.1624 6_7288 3\"" Send data ' Exce' Column sum: Column sum: Column sum: illlllllg 2733200 2563541 15-8593 Figure501 55 GU 65 70 75 80 Answer the following. (a) The total variation in the sample y-values is given by the |(Choose one) V , which for these data is (Choose one) V . (b) The proportion of the total variation in the sample yvalues that can be explained by the estimated linear relationship between x and y is I]. (Round your answer to at least 2 decimal places.) (c) The least-squares regression line given above is said to be a line that "best fits" the sample data. The term "best fits" is used because the line has an equation that minimizes the (Choose one) V , which for these data is (Choose one) V . (a) The total variation in the sample y-values is given by the (Choose one) which for these data is (Choose one) error sum of squares total sum of squares regression sum of squares(a) The total variation in the sample y-values is given by the (Choose one) V which for these data is (Choose one) 273.3200 256.3541 (b) 15.8593 the total variation in the sample y-values that can be explained by the estimated linear relationship between x and y is . ( Round your answer to at least 2 decimal places.)(c) The least-squares regression line given above is said to be a line that "best fits" the sample data. The term "best fits" is used because the line has an equation that minimizes the (choose one) V , which for these data is (Choose one) V . error sum of s-uares total sum of squares regression sum of squares 273.3200 (c) The lea 256.3541 ion line given above is said to be a line that "best fits" the sample data. The term "best fits" is 15,8593 ine has an equation that minimizes the [(Choose one) V , which for these data is (Choose one) V
Step by Step Solution
There are 3 Steps involved in it
Step: 1
Get Instant Access to Expert-Tailored Solutions
See step-by-step solutions with expert insights and AI powered tools for academic success
Step: 2
Step: 3
Ace Your Homework with AI
Get the answers you need in no time with our AI-driven, step-by-step assistance
Get Started