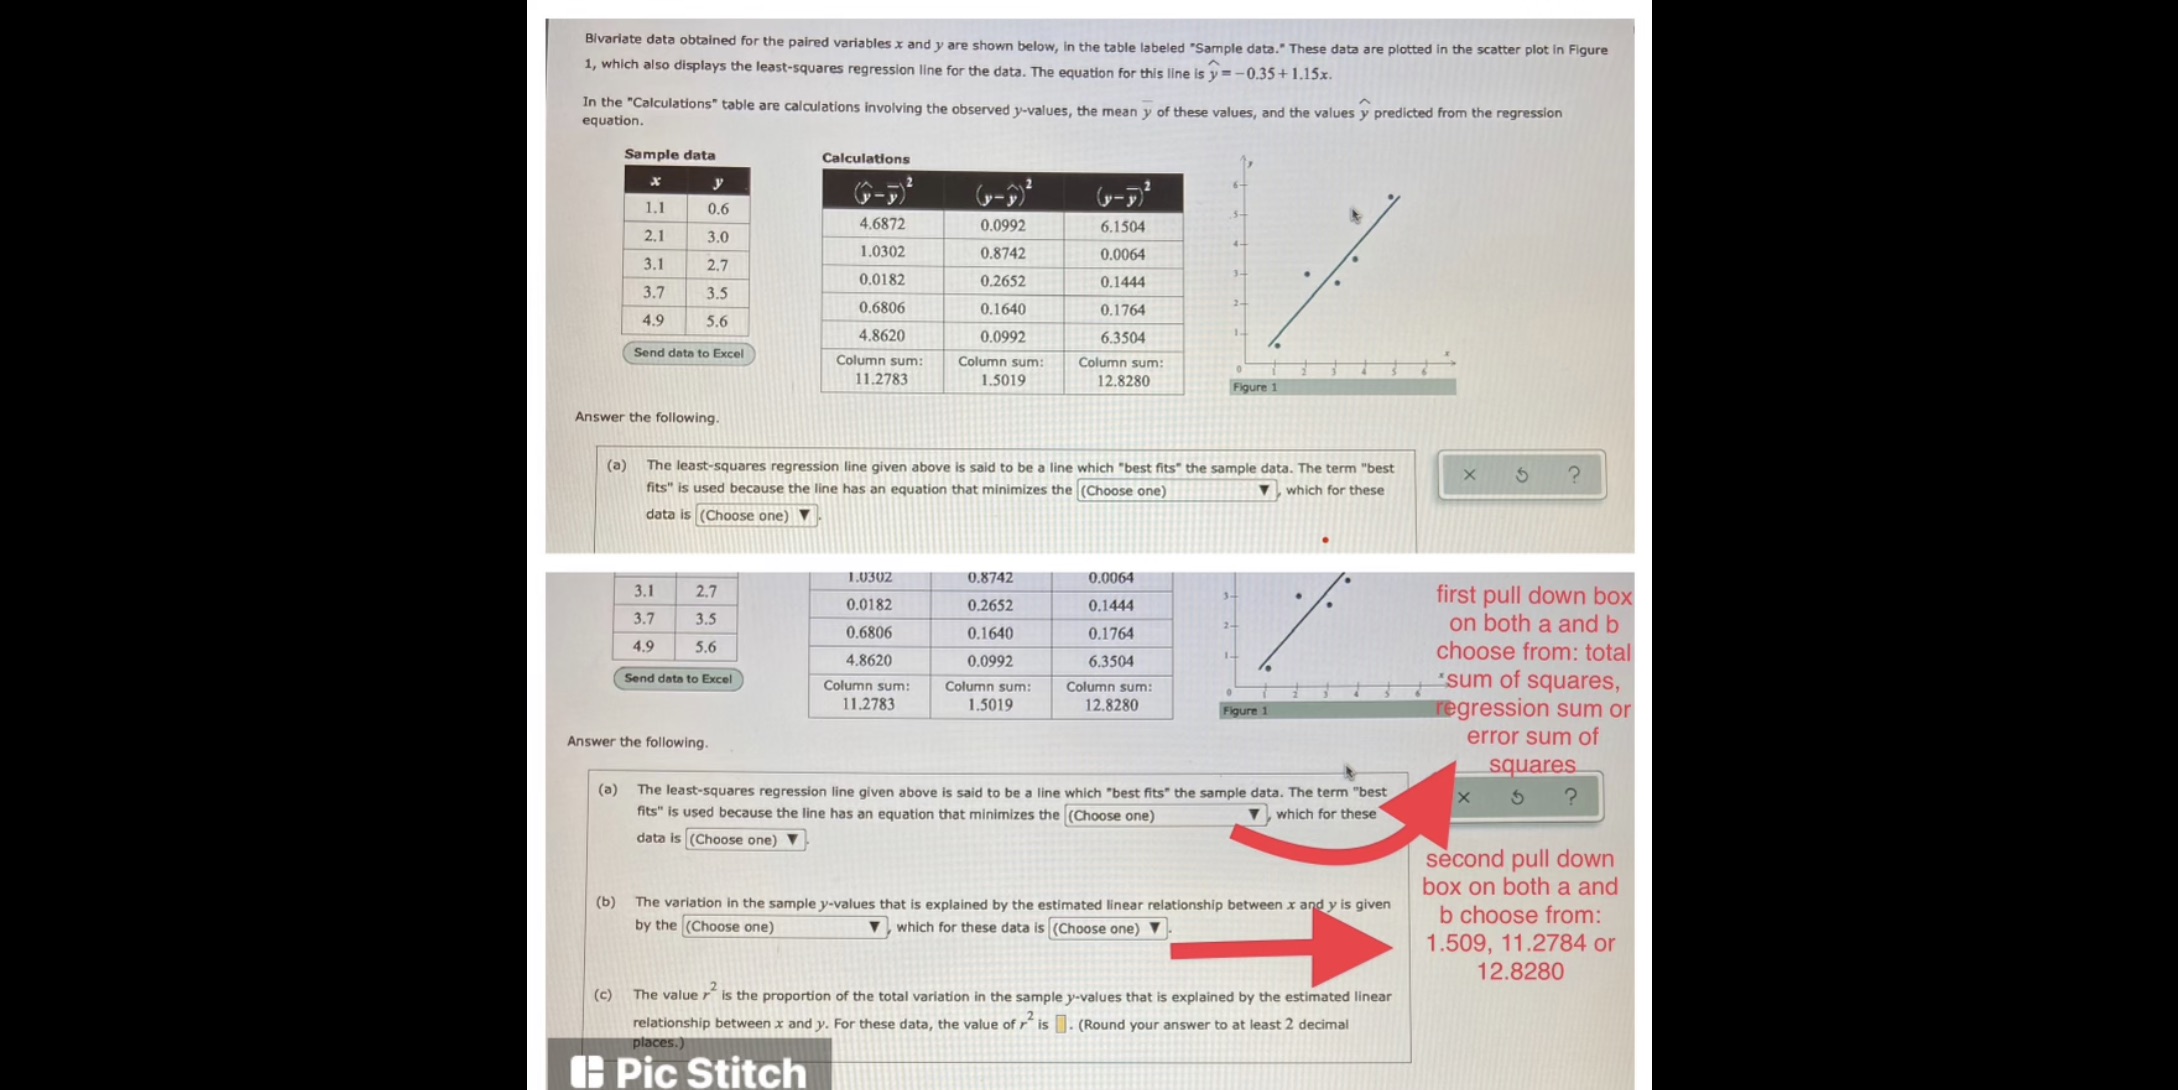
Bivariate data obtained for the paired variables x and y are shown below, in the table labeled "Sample data." These data are plotted in the scatter plot in Figure 1, which also displays the least-squares regression line for the data. The equation for this line is y = -0.35 + 1.15x. In the "Calculations" table are calculations involving the observed y-values, the mean y of these values, and the values y predicted from the regression equation. Sample data Calculations X 1.1 0.6 4.6872 0.0992 6.1504 2.1 3.0 1.0302 0.8742 0.0064 3. 2.7 0.0182 0.2652 0.1444 3.7 3.5 0.6806 0.1640 0.1764 4.9 5.6 4.8620 0.0992 6.3504 Send data to Excel Column sum: Column sum: Column sum: 11.2783 1.5019 12.8280 Figure 1 Answer the following (a) The least-squares regression line given above is said to be a line which "best fits" the sample data. The term "best X fits" is used because the line has an equation that minimizes the (Choose one) which for these data is (Choose one) 1.0302 0.8742 0.0064 3.1 2.7 0.1444 first pull down box 0.0182 0.2652 3.7 3.5 0.6806 0.1640 0.1764 on both a and b 4.9 5.6 4.8620 0.0992 6.3504 choose from: total Send data to Excel Column sum: Column sum: Column sum: 'sum of squares, 11.2783 1.5019 12.8280 Figure 1 regression sum or error sum of Answer the following. squares (a) The least-squares regression line given above is said to be a line which "best fits" the sample data. The term "best X fits" is used because the line has an equation that minimizes the (Choose one) V, which for these data is (Choose one) V second pull down box on both a and (b) The variation in the sample y-values that is explained by the estimated linear relationship between x and y is given b choose from: by the (Choose one) v . which for these data is (Choose one) V 1.509, 11.2784 or 12.8280 (c) The value r is the proportion of the total variation in the sample y-values that is explained by the estimated linear relationship between x and y. For these data, the value of r is ]. (Round your answer to at least 2 decimal Pic Stitch