Answered step by step
Verified Expert Solution
Link Copied!

Question

1 Approved Answer

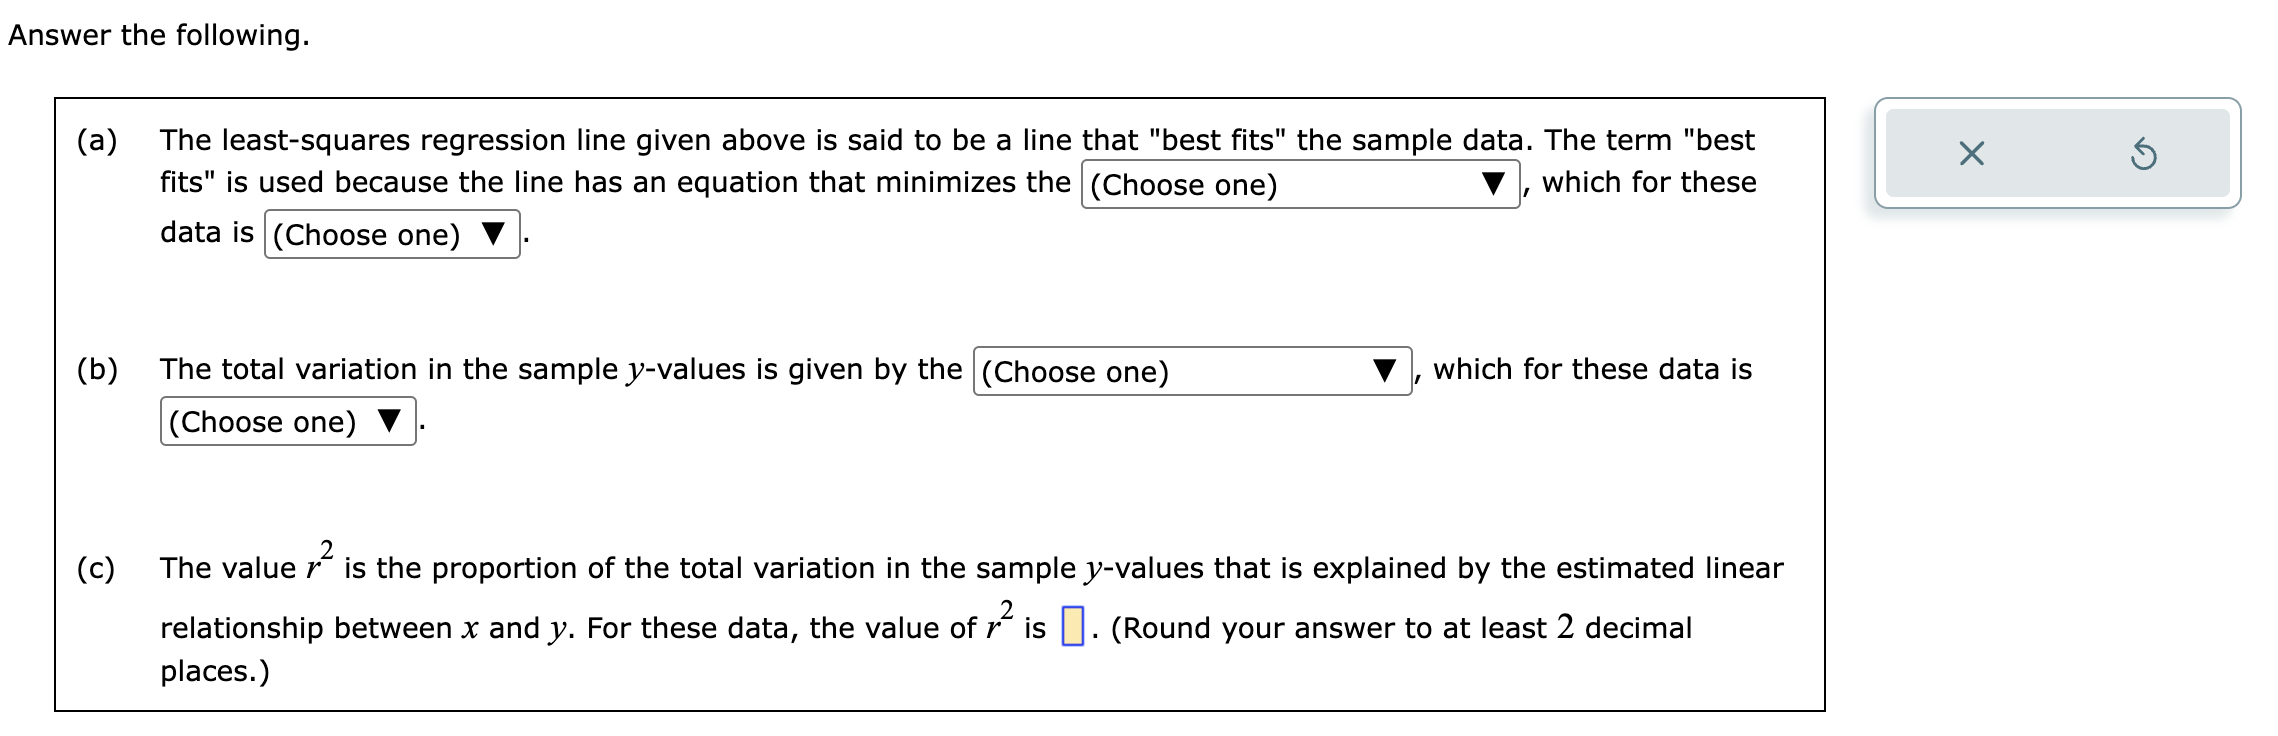
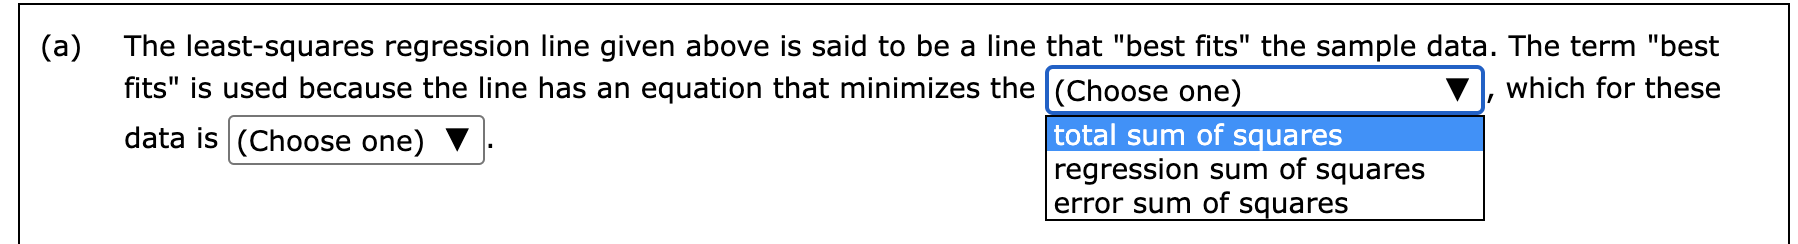
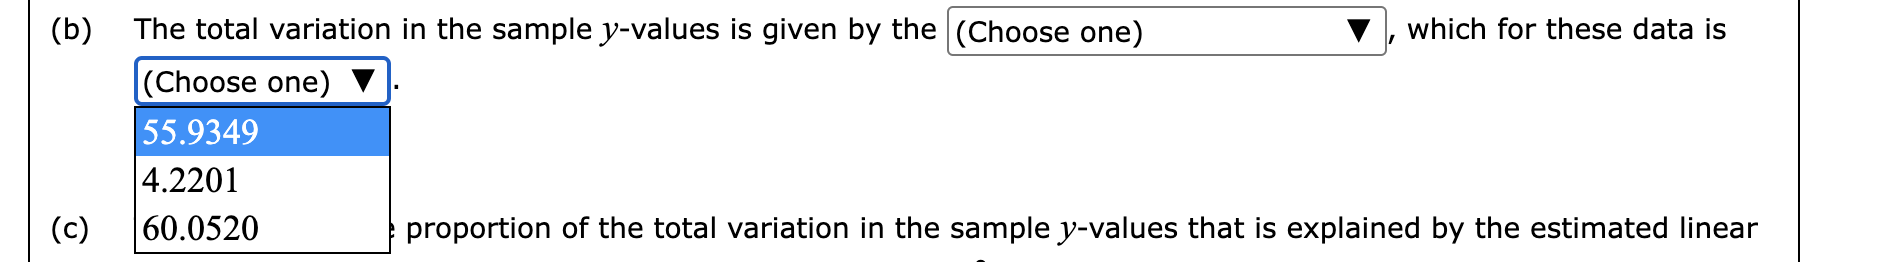
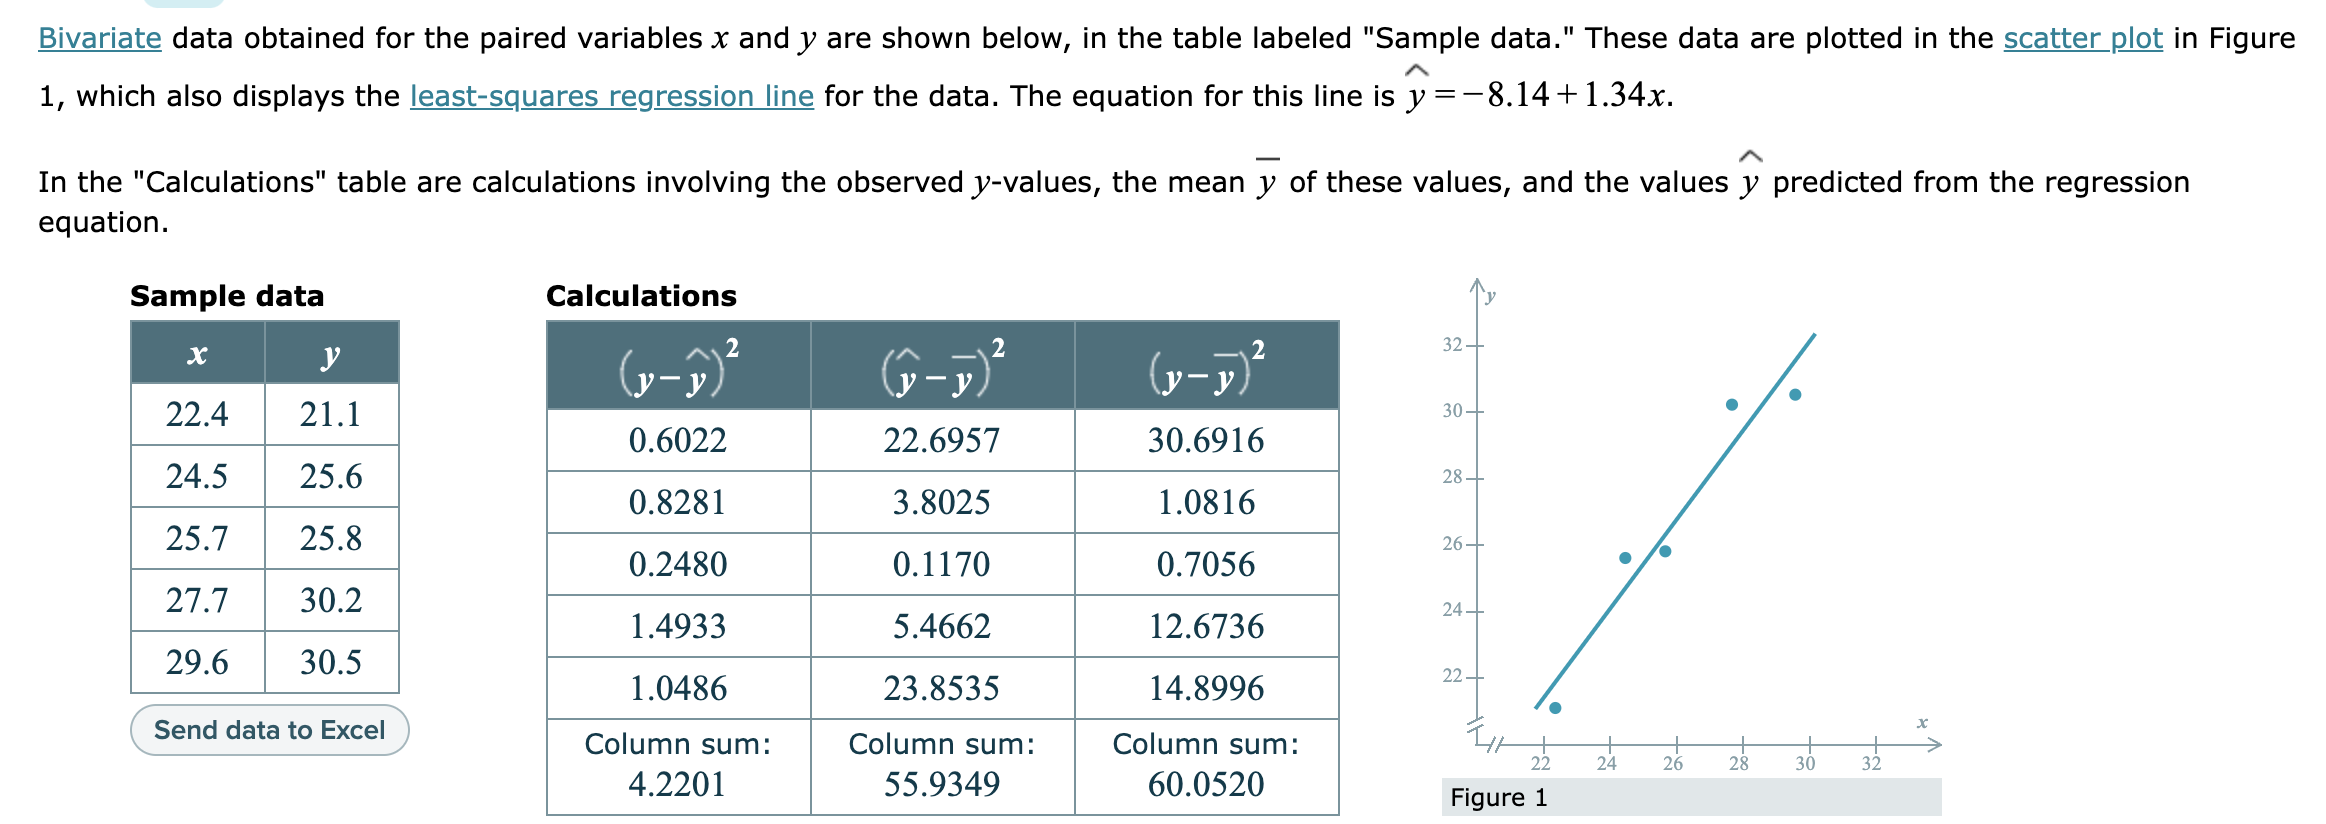
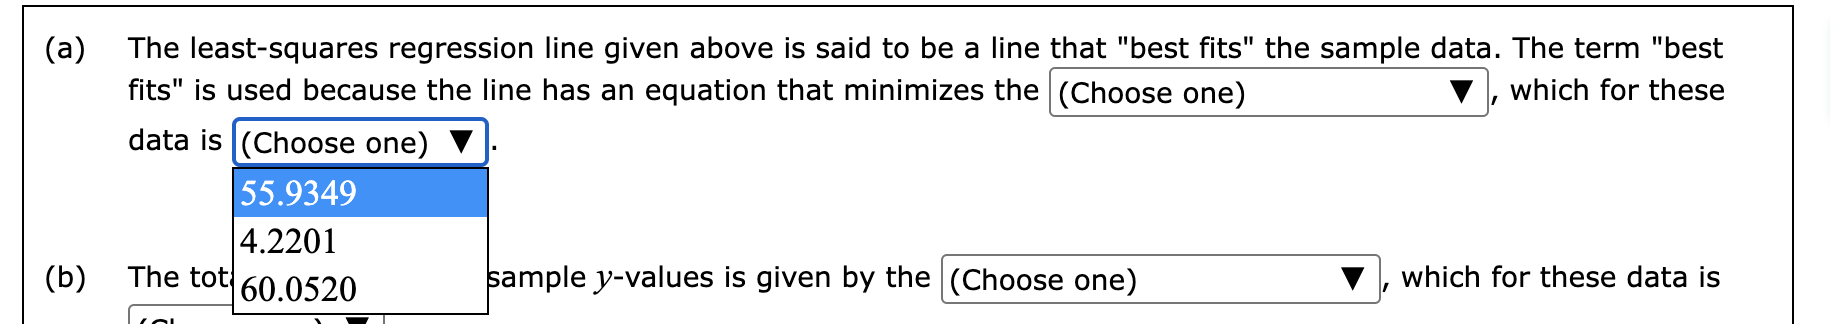
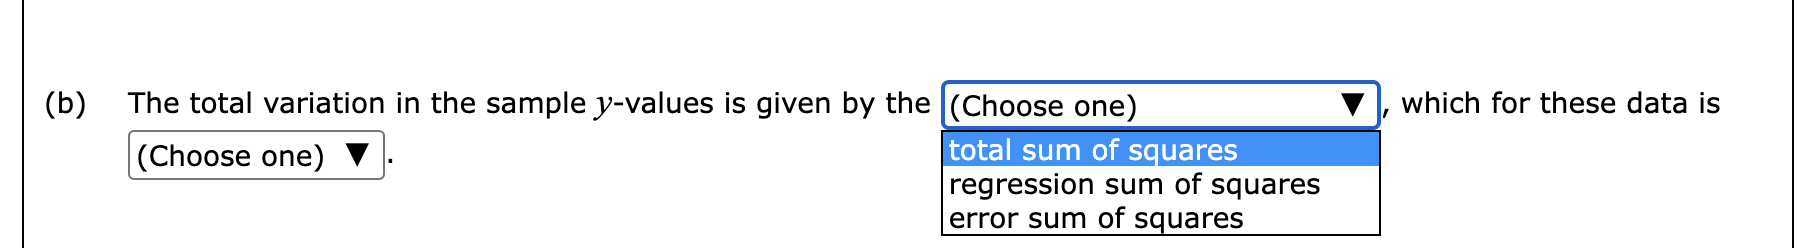
Bivariate data obtained for the paired variablesx and y are shown below, in the table labeled Sample data. These data are plotted in the scatter

image text in transcribedimage text in transcribedimage text in transcribedimage text in transcribedimage text in transcribedimage text in transcribed
Bivariate data obtained for the paired variablesx and y are shown below, in the table labeled "Sample data." These data are plotted in the scatter [M in Figure A 1, which also displays the least-squares regression line for the data. The equation for this line is y =-8.14+ 1.34x. _ A In the "Calculations" table are calculations involving the observed y-values, the mean y of these values, and the values )1 predicted from the regression equation. Sample data Calculations .v x A 2 /\\ _ 2 2 0-.) 0-.) l.-.) . . 0.6022 22.6957 306916 24.5 25.6 0.8281 3.8025 1.0816 25.7 25.8 0.2480 0.1170 0.7056 27.7 30.2 1.4933 5.4662 12.6736 29.6 30.5 . 1.0486 23.8535 14.8996 ' send data 1 Excel / Column sum: Column sum: Column sum: 4.2201 55.9349 60.0520 Figure 1 Answer the following. (a) (b) (C) The leastsquares regression line given above is said to be a line that "best fits" the sample data. The term "best fits" is used because the line has an equation that minimizes the (choose one) V , which for these data iS (Choose one) V . The total variation in the sample yvalues is given by the (choose one) V , which for these data is (Choose one) V . The value r2 is the proportion of the total variation in the sample yvalues that is explained by the estimated linear relationship between x and y. For these data, the value of r2 is . (Round your answer to at least 2 decimal places.) (a) The least-squares regression line given above is said to be a line that "best ts" the sample data. The term \"best fits" is used because the line has an equation that minimizes the (choose one) V , which for these data is (Choose one) V . total sum of s-uares regression sum of squares error sum of squares (a) The least-squares regression line given above is said to be a line that "best ts" the sample data. The term \"best fits" is used because the line has an equation that minimizes the (choose one) V , which for these data is (Choose one) V . 55.9349 4.2201 (b) The tot 60 0520 ample y-values is given by the (Choose one) V , which for these data is (b) The total variation in the sample y-values is given by the (Choose one) which for these data is (Choose one) total sum of squares regression sum of squares error sum of squares(b) The total variation in the sample y-values is given by the (Choose one) V , which for these data is (Choose one) V . 55.9349 4.2201 (c) 60.0520 proportion of the total variation in the sample y-values that is explained by the estimated linear

Step by Step Solution

There are 3 Steps involved in it

Step: 1

blur-text-image

Get Instant Access to Expert-Tailored Solutions

See step-by-step solutions with expert insights and AI powered tools for academic success

Step: 2

blur-text-image

Step: 3

blur-text-image

Ace Your Homework with AI

Get the answers you need in no time with our AI-driven, step-by-step assistance

Get Started

Recommended Textbook for

Physics For Scientists And Engineers

Authors: Raymond A Serway, John W Jewett

10th Edition

1337671711, 9781337671712

More Books

Students also viewed these Mathematics questions

Question

What is bundling? What are the upsides and downsides of bundling?

Answered: 1 week ago

Question

1. What will happen in the future

Answered: 1 week ago

Question

3. Avoid making mistakes when reaching our goals

Answered: 1 week ago