

Question
Black Tyres (BT) manufactures and sells two products in Australia: low-budget tyres and high performance tyres. Low-budget tyres are made from hard rubber for durability
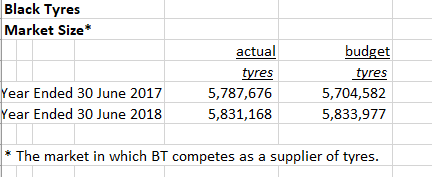
Black Tyres (BT) manufactures and sells two products in Australia: low-budget tyres and high performance tyres. Low-budget tyres are made from hard rubber for durability while high performance tyres are made from softer rubber for superior grip in wet conditions. When the low-budget model was introduced in the market, another competitor from India introduced low priced tyres with almost alike features. Due to this, the Sales Director decides to reduce the price of low-budget tyres so that sales do not get hurt. At the same time, the sales director decided to run a marketing campaign demonstrating the benefits of high performance tyres and promoting the brand to the top-segment customers. The campaign focused on unique features and safety of high-performance tyres. The market is growing by about 0.8% per year, with strong competition due to tyres imported from India. The CFO, Peter Srock, has provided extracts from last years actual income statement and profit plan. When Peter prepared the budget in November 2017, he expected and assumed that the market would grow by 0.80% compared to the previous year. When he received the Annual Tyre Industry Report, he found that the market actually grew by 0.75%.
Q: Prepare a short report outlining BTs performance for the year ended 30 June 2018. The focus of your report should be on how the variances may relate to each other. Suggest any issues that may warrant further investigation by Peter.
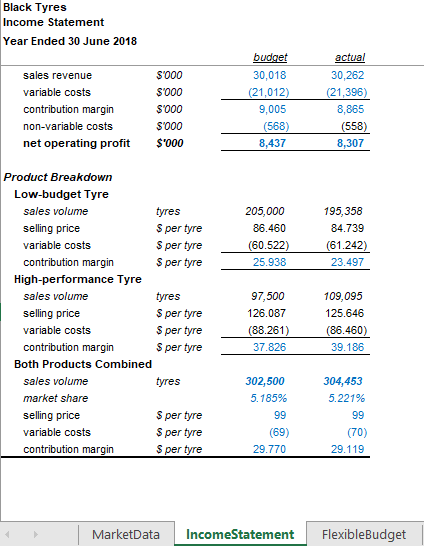
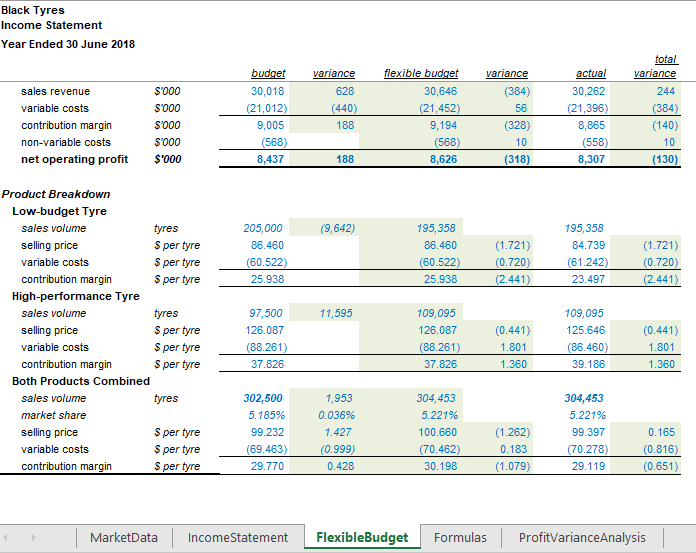
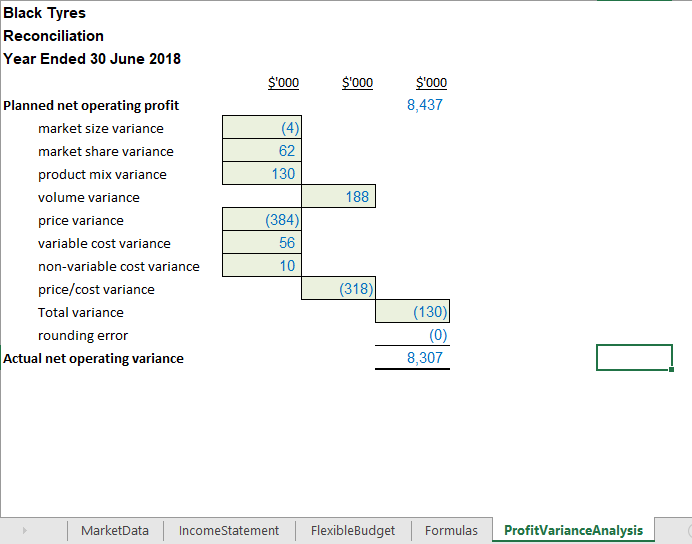
Black Tyres Market Size* Year Ended 30 June 2017 Year Ended 30 June 2018 actual tyres 5,787,676 5,831,168 budget tyres 5,704,582 5,833,977 * The market in which BT competes as a supplier of tyres. Black Tyres Income Statement Year Ended 30 June 2018 sales revenue variable costs contribution margin non-variable costs net operating profit S000 $'000 S'000 s'000 $'000 budget 30,018 (21,012) 9,005 (568) 8,437 actual 30,262 (21,396) 8,865 (558) 8,307 205,000 86.460 (60.522) 25.938 195,358 84.739 (61.242) 23.497 Product Breakdown Low-budget Tyre sales volume tyres selling price S per tyre variable costs S per tyre contribution margin Sper tyre High-performance Tyre sales volume tyres selling price S per tyre variable costs S per tyre contribution margin Sper tyre Both Products Combined sales volume tyres market share selling price S per tyre variable costs S per tyre contribution margin Sper tyre 97,500 126.087 (88.261) 37.826 109,095 125.646 (86.460) 39.186 302,500 5.185% 99 (69) 29.770 304,453 5.221% 99 (70) 29.119 MarketData Income Statement FlexibleBudget Black Tyres Income Statement Year Ended 30 June 2018 actual sales revenue variable costs contribution margin non-variable costs net operating profit S'000 $000 S000 S000 $'000 budget 30,018 (21,012) 9,005 (568) 8,437 variance 628 (440) 188 flexible budget 30,646 (21,452) 9,194 (568) 8,626 variance (384) 56 (328) 10 (318) 30,262 (21,396) 8,865 (558) 8,307 total variance 244 (384) (140) 10 (130) 188 (9,642) 205,000 86.460 (60.522) 25.938 195,358 86.460 (60.522) 25.938 (1.721) (0.720) (2.441) 195,358 84.739 (61.242) 23.497 (1.721) (0.720) (2.441) 11,595 Product Breakdown Low-budget Tyre sales volume tyres selling price S per tyre variable costs S per tyre contribution margin Sper tyre High-performance Tyre sales volume tyres selling price S per tyre variable costs S per tyre contribution margin S per tyre Both Products Combined sales volume tyres market share selling price S per tyre variable costs S per tyre contribution margin Sper tyre 97,500 126.087 (88.261) 37.826 109,095 126.087 (88.261) 37.826 (0.441) 1.801 1.360 109,095 125.646 (86.460) 39.186 (0.441) 1.801 1.360 302,500 5.185% 99.232 (69.463) 29.770 1,953 0.036% 1.427 (0.999) 0.428 304,453 5.221% 100.660 (70.462) 30.198 (1.262) 0.183 (1.079) 304,453 5.221% 99.397 (70.278) 29.119 0.165 (0.816) (0.651) MarketData IncomeStatement FlexibleBudget Formulas ProfitVariance Analysis Black Tyres Reconciliation Year Ended 30 June 2018 $'000 $'000 $'000 8,437 (4) 62 130 188 Planned net operating profit market size variance market share variance product mix variance volume variance price variance variable cost variance non-variable cost variance price/cost variance Total variance rounding error Actual net operating variance (384) 56 10 (318) (130) (0) 8,307 MarketData Income Statement FlexibleBudget Formulas ProfitVariance Analysis Black Tyres Market Size* Year Ended 30 June 2017 Year Ended 30 June 2018 actual tyres 5,787,676 5,831,168 budget tyres 5,704,582 5,833,977 * The market in which BT competes as a supplier of tyres. Black Tyres Income Statement Year Ended 30 June 2018 sales revenue variable costs contribution margin non-variable costs net operating profit S000 $'000 S'000 s'000 $'000 budget 30,018 (21,012) 9,005 (568) 8,437 actual 30,262 (21,396) 8,865 (558) 8,307 205,000 86.460 (60.522) 25.938 195,358 84.739 (61.242) 23.497 Product Breakdown Low-budget Tyre sales volume tyres selling price S per tyre variable costs S per tyre contribution margin Sper tyre High-performance Tyre sales volume tyres selling price S per tyre variable costs S per tyre contribution margin Sper tyre Both Products Combined sales volume tyres market share selling price S per tyre variable costs S per tyre contribution margin Sper tyre 97,500 126.087 (88.261) 37.826 109,095 125.646 (86.460) 39.186 302,500 5.185% 99 (69) 29.770 304,453 5.221% 99 (70) 29.119 MarketData Income Statement FlexibleBudget Black Tyres Income Statement Year Ended 30 June 2018 actual sales revenue variable costs contribution margin non-variable costs net operating profit S'000 $000 S000 S000 $'000 budget 30,018 (21,012) 9,005 (568) 8,437 variance 628 (440) 188 flexible budget 30,646 (21,452) 9,194 (568) 8,626 variance (384) 56 (328) 10 (318) 30,262 (21,396) 8,865 (558) 8,307 total variance 244 (384) (140) 10 (130) 188 (9,642) 205,000 86.460 (60.522) 25.938 195,358 86.460 (60.522) 25.938 (1.721) (0.720) (2.441) 195,358 84.739 (61.242) 23.497 (1.721) (0.720) (2.441) 11,595 Product Breakdown Low-budget Tyre sales volume tyres selling price S per tyre variable costs S per tyre contribution margin Sper tyre High-performance Tyre sales volume tyres selling price S per tyre variable costs S per tyre contribution margin S per tyre Both Products Combined sales volume tyres market share selling price S per tyre variable costs S per tyre contribution margin Sper tyre 97,500 126.087 (88.261) 37.826 109,095 126.087 (88.261) 37.826 (0.441) 1.801 1.360 109,095 125.646 (86.460) 39.186 (0.441) 1.801 1.360 302,500 5.185% 99.232 (69.463) 29.770 1,953 0.036% 1.427 (0.999) 0.428 304,453 5.221% 100.660 (70.462) 30.198 (1.262) 0.183 (1.079) 304,453 5.221% 99.397 (70.278) 29.119 0.165 (0.816) (0.651) MarketData IncomeStatement FlexibleBudget Formulas ProfitVariance Analysis Black Tyres Reconciliation Year Ended 30 June 2018 $'000 $'000 $'000 8,437 (4) 62 130 188 Planned net operating profit market size variance market share variance product mix variance volume variance price variance variable cost variance non-variable cost variance price/cost variance Total variance rounding error Actual net operating variance (384) 56 10 (318) (130) (0) 8,307 MarketData Income Statement FlexibleBudget Formulas ProfitVariance AnalysisStep by Step Solution
There are 3 Steps involved in it
Step: 1

Get Instant Access to Expert-Tailored Solutions
See step-by-step solutions with expert insights and AI powered tools for academic success
Step: 2

Step: 3
Ace Your Homework with AI
Get the answers you need in no time with our AI-driven, step-by-step assistance
Get Started
Bucks The Next Step Advanced Medical Coding And Auditing
Authors: Elsevier
1st Edition
0323874118, 978-0323874113