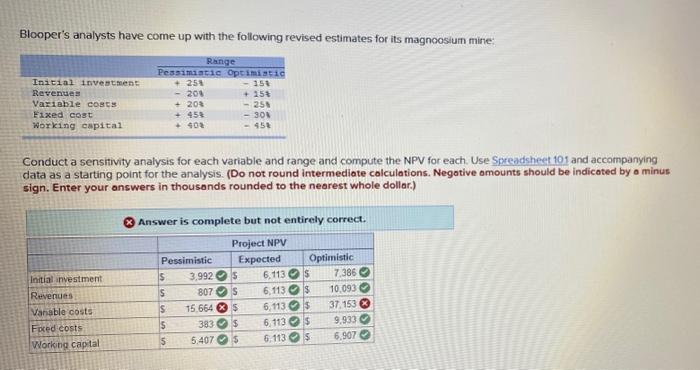
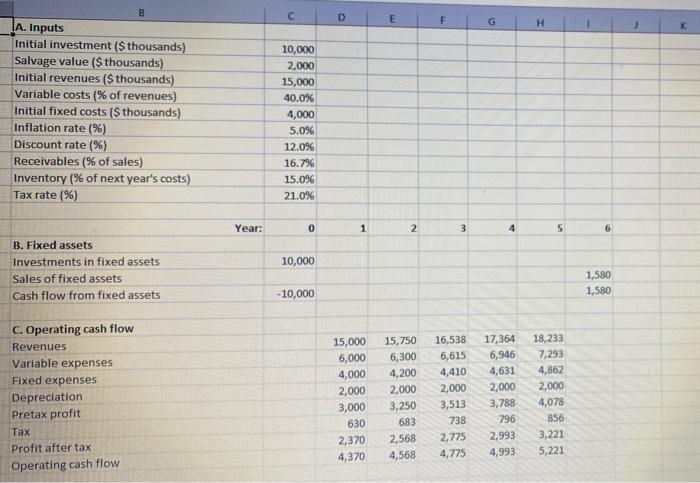
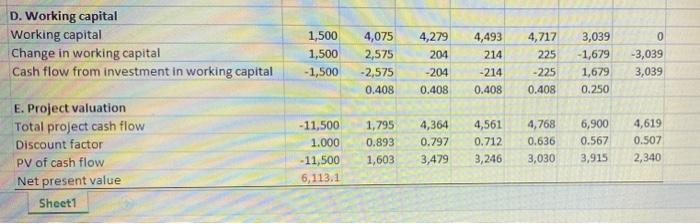
Blooper's analysts have come up with the following revised estimates for its magnoosium mine Initial investment Revenues Variable co Eixed cost Working capital Range Pessimistic Optimistic +254 - 150 - 200 + 25% + 200 - 250 + 453 - 30 + 405 -450 Conduct a sensitivity analysis for each variable and range and compute the NPV for each. Use Spreadsheet 101 and accompanying data as a starting point for the analysis. (Do not round intermediate calculations. Negative amounts should be indicated by a minus sign. Enter your answers in thousands rounded to the nearest whole dollar) Answer is complete but not entirely correct. Initial investment Revenues Vanable costs Foxed costs Working capital Project NPV Pessimistic Expected Optimistic IS 3.9925 6.113 $ 7.386 S 807S 6,113 $ 10.093 S 15 664 x 5 6,113$ 37.153 $ 383 $ 6,113s 9.933 5 5,4075 6.113 5 6.907 B c D E G H K A. Inputs Initial investment ($ thousands) Salvage value ($ thousands) Initial revenues ($ thousands) Variable costs % of revenues) Initial fixed costs ($ thousands) Inflation rate (%) Discount rate (%) Receivables (% of sales) Inventory (% of next year's costs) Tax rate (%) 10,000 2,000 15,000 40.0% 4,000 5.0% 12.0% 16.7% 15.0% 21.0% Year: 0 1 2 3 4 5 6 10,000 B. Fixed assets Investments in fixed assets Sales of fixed assets Cash flow from fixed assets 1.580 - 10,000 1,580 C. Operating cash flow Revenues Variable expenses Fixed expenses Depreciation Pretax profit Tax Profit after tax Operating cash flow 15,000 6,000 4,000 2,000 3,000 630 2,370 4,370 15,750 6,300 4,200 2,000 3,250 683 2,568 4,568 16,538 6,615 4,410 2,000 3,513 738 2,775 4,775 17,364 6,946 4,631 2,000 3,788 796 2,993 4,993 18,233 7,293 4,862 2,000 4,078 856 3,221 5,221 D. Working capital Working capital Change in working capital Cash flow from investment in working capital 1,500 1,500 - 1,500 4,075 2,575 -2,575 0.408 4,279 204 -204 0.408 4,493 214 -214 0.408 4,717 225 -225 0.408 3,039 -1,679 1,679 0.250 0 -3,039 3,039 E. Project valuation Total project cash flow Discount factor PV of cash flow Net present value Sheet1 -11,500 1.000 -11,500 6,113.1 1,795 0.893 1,603 4,364 0.797 3,479 4,561 0.712 3,246 4,768 0.636 3,030 6,900 0.567 3,915 4,619 0.507 2,340 Blooper's analysts have come up with the following revised estimates for its magnoosium mine Initial investment Revenues Variable co Eixed cost Working capital Range Pessimistic Optimistic +254 - 150 - 200 + 25% + 200 - 250 + 453 - 30 + 405 -450 Conduct a sensitivity analysis for each variable and range and compute the NPV for each. Use Spreadsheet 101 and accompanying data as a starting point for the analysis. (Do not round intermediate calculations. Negative amounts should be indicated by a minus sign. Enter your answers in thousands rounded to the nearest whole dollar) Answer is complete but not entirely correct. Initial investment Revenues Vanable costs Foxed costs Working capital Project NPV Pessimistic Expected Optimistic IS 3.9925 6.113 $ 7.386 S 807S 6,113 $ 10.093 S 15 664 x 5 6,113$ 37.153 $ 383 $ 6,113s 9.933 5 5,4075 6.113 5 6.907 B c D E G H K A. Inputs Initial investment ($ thousands) Salvage value ($ thousands) Initial revenues ($ thousands) Variable costs % of revenues) Initial fixed costs ($ thousands) Inflation rate (%) Discount rate (%) Receivables (% of sales) Inventory (% of next year's costs) Tax rate (%) 10,000 2,000 15,000 40.0% 4,000 5.0% 12.0% 16.7% 15.0% 21.0% Year: 0 1 2 3 4 5 6 10,000 B. Fixed assets Investments in fixed assets Sales of fixed assets Cash flow from fixed assets 1.580 - 10,000 1,580 C. Operating cash flow Revenues Variable expenses Fixed expenses Depreciation Pretax profit Tax Profit after tax Operating cash flow 15,000 6,000 4,000 2,000 3,000 630 2,370 4,370 15,750 6,300 4,200 2,000 3,250 683 2,568 4,568 16,538 6,615 4,410 2,000 3,513 738 2,775 4,775 17,364 6,946 4,631 2,000 3,788 796 2,993 4,993 18,233 7,293 4,862 2,000 4,078 856 3,221 5,221 D. Working capital Working capital Change in working capital Cash flow from investment in working capital 1,500 1,500 - 1,500 4,075 2,575 -2,575 0.408 4,279 204 -204 0.408 4,493 214 -214 0.408 4,717 225 -225 0.408 3,039 -1,679 1,679 0.250 0 -3,039 3,039 E. Project valuation Total project cash flow Discount factor PV of cash flow Net present value Sheet1 -11,500 1.000 -11,500 6,113.1 1,795 0.893 1,603 4,364 0.797 3,479 4,561 0.712 3,246 4,768 0.636 3,030 6,900 0.567 3,915 4,619 0.507 2,340